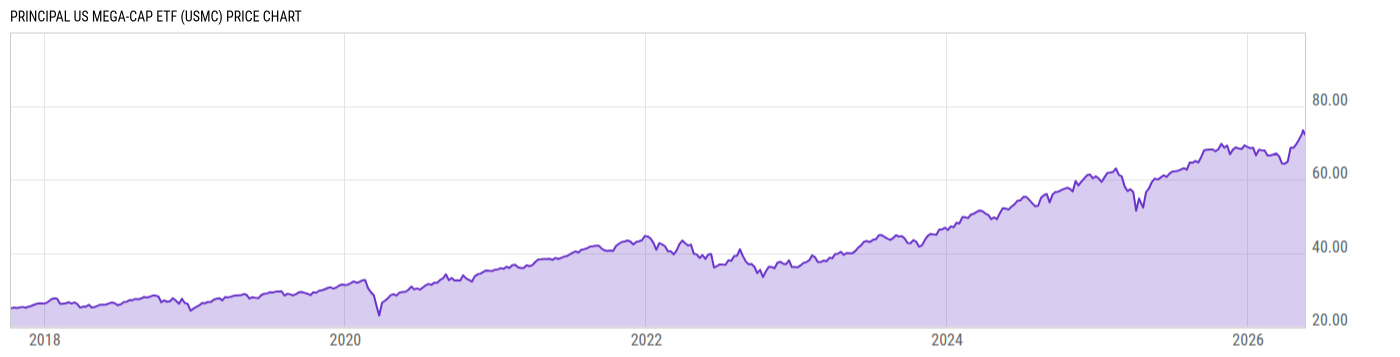
Key Stats

Expense Ratio Discount or Premium to NAV Total Assets Under Management 30-Day Average Daily Volume
0.12% 0.03% 1.131B 24957.37
Dividend Yield Turnover Ratio 1 Year Fund Level Flows Max Drawdown (All)
1.24% 41.10% -327.13M Upgrade

Basic Info

Investment Strategy
The investment seeks long-term growth of capital. Under normal circumstances, the fund invests at least 80% of its net assets, plus any borrowings for investment purposes, in equity securities of U.S. companies with very large ("mega") market capitalizations at the time of purchase. For this fund, companies with mega capitalizations are those with market capitalizations in the top 50th percentile of the S&P 500 Index at the time of purchase.
General
Security Type Exchange-Traded Fund
Equity Style Large Cap/Growth
Fixed Income Style --
Broad Asset Class US Equity
Broad Category Equity
Category Name Large Blend
Category Index Russell 1000 TR USD
Global Category Name US Equity Large Cap Blend
YCharts Categorization US Large Cap Blend
YCharts Benchmark S&P 500 Total Return (^SPXTR)
Prospectus Objective Growth and Income
Fund Owner Firm Name Principal Funds
Prospectus Benchmark Index
S&P 500 TR USD 100.0%
Broad Asset Class Benchmark Index
^SPXTR 100.0%
Manager Tenure
Jeffrey Schwarte 5.39 yrs
Aaron Siebel 2.99 yrs

Net Fund Flows Versus Category

View Net Fund Flows. Upgrade now.
1M
3M
6M
YTD
1Y
3Y
5Y
10Y
 
80.00B
60.00B
40.00B
20.00B
0
-20.00B
1 Month
% Rank: --
-- Category Low
-- Category High
1 Year
% Rank: 82
-327.13M
-24.24B Category Low
51.36B Category High
3 Months
% Rank: --
-- Category Low
-- Category High
3 Years
% Rank: --
-- Category Low
-- Category High
6 Months
% Rank: --
-- Category Low
-- Category High
5 Years
% Rank: --
-- Category Low
-- Category High
YTD
% Rank: --
-- Category Low
-- Category High
10 Years
% Rank: --
-- Category Low
-- Category High
As of February 28, 2023

Performance Versus Category

 
20%
15%
10%
5%
0
View Category Returns. Upgrade now.
Name
1M
3M
YTD
1Y
3Y
5Y
10Y
15Y
Total Return (Price)
--
--
--
--
--
--
--
--
Total Return (NAV)
--
--
--
--
--
--
--
--
Category Rtn. (NAV)
--
--
--
--
--
--
--
--
% Rank in Cat (NAV)
--
--
--
--
--
--
--
--
As of March 23, 2023. Returns for periods of 1 year and above are annualized.

Annual Total Returns Versus Peers

Loading chart...
Name
2016
2017
2018
2019
2020
2021
2022
YTD
--
--
-2.29%
27.40%
16.07%
26.29%
-17.18%
6.96%
11.96%
21.83%
-4.38%
31.49%
18.40%
28.71%
-18.11%
3.28%
11.82%
21.30%
-4.77%
31.99%
18.52%
28.78%
-18.10%
3.21%
12.17%
21.77%
-4.50%
31.35%
18.29%
28.78%
-18.19%
3.22%
--
24.63%
-2.29%
34.60%
16.21%
29.58%
-16.53%
1.93%
12.16%
21.76%
-4.47%
31.25%
18.40%
28.76%
-18.16%
3.20%
As of March 23, 2023.

Fundamentals

General
Distribution Yield Upgrade
Dividend Yield TTM (3-24-23) 1.24%
30-Day SEC Yield (2-28-23) Upgrade
7-Day SEC Yield --
Number of Holdings Upgrade
Stock
Weighted Average PE Ratio 20.66
Weighted Average Price to Sales Ratio Upgrade
Weighted Average Price to Book Ratio Upgrade
Weighted Median ROE Upgrade
Weighted Median ROA Upgrade
Forecasted Dividend Yield Upgrade
Forecasted PE Ratio Upgrade
Forecasted Price to Sales Ratio Upgrade
Forecasted Price to Book Ratio Upgrade
As of March 22, 2023

Growth Estimates

Forecasted 5 Yr Earnings Growth Upgrade
Forecasted Book Value Growth Upgrade
Forecasted Cash Flow Growth Upgrade
Forecasted Earnings Growth Upgrade
Forecasted Revenue Growth Upgrade
As of March 22, 2023

Asset Allocation

As of March 22, 2023.
Type % Net % Long % Short
Cash 0.30% Upgrade Upgrade
Stock 99.70% Upgrade Upgrade
Bond 0.00% Upgrade Upgrade
Convertible 0.00% Upgrade Upgrade
Preferred 0.00% Upgrade Upgrade
Other 0.00% Upgrade Upgrade

Top 10 Holdings

Name % Weight Price % Change
Apple Inc 6.99% 159.45 0.33%
NVIDIA Corp 6.36% 265.56 -2.34%
Microsoft Corp 5.96% 278.23 0.21%
Meta Platforms Inc Class A 4.60% 204.90 0.30%
Mastercard Inc Class A 3.48% 351.22 -0.89%
Visa Inc Class A 3.46% 220.71 -0.84%
AbbVie Inc 3.13% 158.08 1.79%
Alphabet Inc Class A 3.06% 104.96 -0.61%
Danaher Corp 3.02% 246.68 -0.10%
Broadcom Inc 2.90% 632.23 -1.10%

Basic Info

Investment Strategy
The investment seeks long-term growth of capital. Under normal circumstances, the fund invests at least 80% of its net assets, plus any borrowings for investment purposes, in equity securities of U.S. companies with very large ("mega") market capitalizations at the time of purchase. For this fund, companies with mega capitalizations are those with market capitalizations in the top 50th percentile of the S&P 500 Index at the time of purchase.
General
Security Type Exchange-Traded Fund
Equity Style Large Cap/Growth
Fixed Income Style --
Broad Asset Class US Equity
Broad Category Equity
Category Name Large Blend
Category Index Russell 1000 TR USD
Global Category Name US Equity Large Cap Blend
YCharts Categorization US Large Cap Blend
YCharts Benchmark S&P 500 Total Return (^SPXTR)
Prospectus Objective Growth and Income
Fund Owner Firm Name Principal Funds
Prospectus Benchmark Index
S&P 500 TR USD 100.0%
Broad Asset Class Benchmark Index
^SPXTR 100.0%
Manager Tenure
Jeffrey Schwarte 5.39 yrs
Aaron Siebel 2.99 yrs

Fundamentals

General
Distribution Yield Upgrade
Dividend Yield TTM (3-24-23) 1.24%
30-Day SEC Yield (2-28-23) Upgrade
7-Day SEC Yield --
Number of Holdings Upgrade
Stock
Weighted Average PE Ratio 20.66
Weighted Average Price to Sales Ratio Upgrade
Weighted Average Price to Book Ratio Upgrade
Weighted Median ROE Upgrade
Weighted Median ROA Upgrade
Forecasted Dividend Yield Upgrade
Forecasted PE Ratio Upgrade
Forecasted Price to Sales Ratio Upgrade
Forecasted Price to Book Ratio Upgrade
As of March 22, 2023

Growth Estimates

Forecasted 5 Yr Earnings Growth Upgrade
Forecasted Book Value Growth Upgrade
Forecasted Cash Flow Growth Upgrade
Forecasted Earnings Growth Upgrade
Forecasted Revenue Growth Upgrade
As of March 22, 2023

Fund Details

Key Dates
Inception Date 10/11/2017
Last Annual Report Date 6/30/2022
Last Prospectus Date 11/1/2022
Attributes
Index Fund Yes
Inverse Fund No
Leveraged Fund No
Fund of Funds No
Currency Hedged Fund No
Synthetic Replication Fund No
Has Dividend Investment Plan No
Socially Responsible Fund No

Top Portfolio Holders

0 of 0