

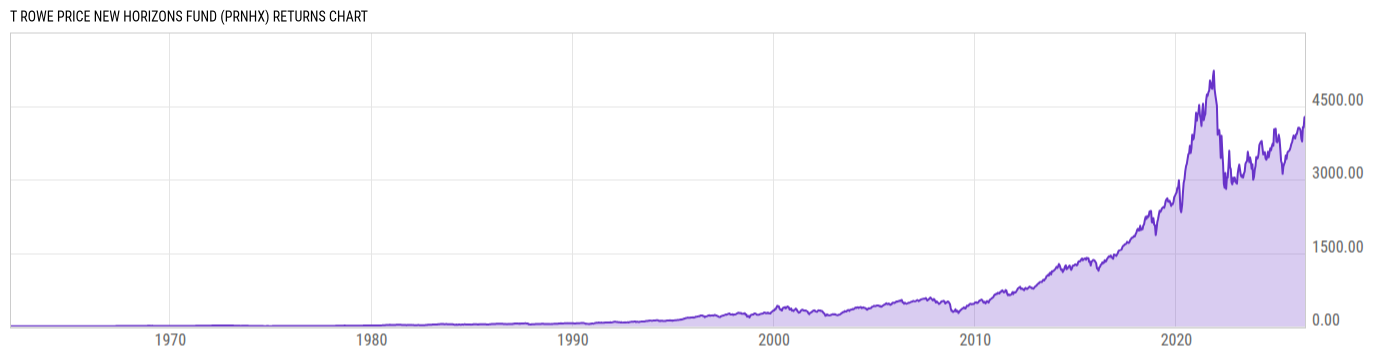
T Rowe Price New Horizons Fund (PRNHX)
57.89
+0.46
(+0.80%)
USD |
May 22 2026
Returns Chart
Key Stats
| Net Expense Ratio | Total Assets Under Management | Weighted Average Dividend Yield | Turnover Ratio (Generic) |
|---|---|---|---|
| 0.80% | 14.01B | 0.47% | 93.00% |
| 1 Year Fund Level Flows | 1 Year Total Returns (Daily) | Annualized Total Returns Since Inception (Daily) | Max Drawdown (Since Inception) |
| -5.045B | 26.77% |
Basic Info
| Investment Strategy | |
| The Fund seeks long-term growth of capital by investing primarily in common stocks of small, rapidly growing companies. |
| General | |
| Security Type | Mutual Fund |
| Equity Style | Mid Cap Growth |
| Broad Asset Class | US Equity |
| Broad Category | Equity |
| Global Peer Group | Equity US Sm&Mid Cap |
| Peer Group | Mid-Cap Growth Funds |
| Global Macro | Equity North America |
| US Macro | Mid-Cap Funds |
| YCharts Categorization | -- |
| YCharts Benchmark | -- |
| Prospectus Objective | Mid-Cap Funds |
| Fund Owner Firm Name | T. Rowe Price |
| Broad Asset Class Benchmark Index | |
| ^SPXTR | 100.0% |
Net Fund Flows Versus Peer Group
1 Month
% Rank:
96
-1.013B
Peer Group Low
357.97M
Peer Group High
1 Year
% Rank:
99
-5.045B
-6.509B
Peer Group Low
2.935B
Peer Group High
3 Months
% Rank:
95
-2.865B
Peer Group Low
977.59M
Peer Group High
3 Years
% Rank:
100
-14.69B
Peer Group Low
4.958B
Peer Group High
6 Months
% Rank:
95
-4.033B
Peer Group Low
1.477B
Peer Group High
5 Years
% Rank:
100
-20.02B
Peer Group Low
9.568B
Peer Group High
YTD
% Rank:
95
-3.039B
Peer Group Low
1.477B
Peer Group High
10 Years
% Rank:
99
-30.29B
Peer Group Low
9.568B
Peer Group High
Date Unavailable
Risk
Performance Versus Peer Group
Annual Total Returns Versus Peers
As of May 25, 2026.
Asset Allocation
As of March 31, 2026.
| Type | % Net |
|---|---|
| Cash | 3.85% |
| Stock | 89.62% |
| Bond | 1.99% |
| Convertible | 0.00% |
| Preferred | 0.45% |
| Other | 4.09% |
Top 10 Holdings
| Name | % Weight | Price | % Change |
|---|---|---|---|
| T Rowe Price Government Money Fund | 5.50% | 1.00 | 0.00% |
|
Other Assets
|
4.67% | -- | -- |
| SiteOne Landscape Supply, Inc. | 1.76% | 113.36 | -1.85% |
| Lattice Semiconductor Corp. | 1.68% | 143.22 | 2.78% |
| Dutch Bros, Inc. | 1.52% | 52.12 | -2.51% |
| Natera, Inc. | 1.48% | 203.19 | -0.25% |
| Teledyne Technologies, Inc. | 1.39% | 620.45 | 2.20% |
| TechnipFMC plc | 1.32% | 70.99 | -0.59% |
| Fabrinet | 1.31% | 703.86 | 0.08% |
| Kymera Therapeutics, Inc. | 1.27% | 78.89 | -2.13% |
Fees & Availability
| Fees | |
| Actual 12B-1 Fee | -- |
| Actual Management Fee | 0.63% |
| Administration Fee | -- |
| Maximum Front Load | -- |
| Maximum Deferred Load | -- |
| Maximum Redemption Fee | -- |
| General Availability | |
| Available for Insurance Product | No |
| Available for RRSP | No |
| Purchase Details | |
| Open to New Investors |
|
| Minimum Initial Investment | 2500.00 None |
| Minimum Subsequent Investment | 100.00 None |
Basic Info
| Investment Strategy | |
| The Fund seeks long-term growth of capital by investing primarily in common stocks of small, rapidly growing companies. |
| General | |
| Security Type | Mutual Fund |
| Equity Style | Mid Cap Growth |
| Broad Asset Class | US Equity |
| Broad Category | Equity |
| Global Peer Group | Equity US Sm&Mid Cap |
| Peer Group | Mid-Cap Growth Funds |
| Global Macro | Equity North America |
| US Macro | Mid-Cap Funds |
| YCharts Categorization | -- |
| YCharts Benchmark | -- |
| Prospectus Objective | Mid-Cap Funds |
| Fund Owner Firm Name | T. Rowe Price |
| Broad Asset Class Benchmark Index | |
| ^SPXTR | 100.0% |
Fundamentals
| General | |
| Distribution Yield | -- |
| Dividend Yield TTM (5-21-26) | 0.02% |
| 30-Day SEC Yield | -- |
| 7-Day SEC Yield | -- |
| Number of Holdings | 317 |
| Stock | |
| Weighted Average PE Ratio | 39.00 |
| Weighted Average Price to Sales Ratio | 9.981 |
| Weighted Average Price to Book Ratio | 7.364 |
| Weighted Median ROE | -1.75% |
| Weighted Median ROA | -1.89% |
| ROI (TTM) | -1.49% |
| Return on Investment (TTM) | -1.49% |
| Earning Yield | 0.0340 |
| LT Debt / Shareholders Equity | 0.8833 |
| Number of Equity Holdings | 307 |
As of March 31, 2026
Growth Metrics
| EPS Growth (1Y) | 15.30% |
| EPS Growth (3Y) | 9.23% |
| EPS Growth (5Y) | 13.09% |
| Sales Growth (1Y) | 21.92% |
| Sales Growth (3Y) | 17.01% |
| Sales Growth (5Y) | 20.37% |
| Sales per Share Growth (1Y) | 450.9% |
| Sales per Share Growth (3Y) | 12.82% |
| Operating Cash Flow - Growth Rate (3Y) | 34.10% |
As of March 31, 2026
Fund Details
Top Portfolio Holders
| Name | % Weight |
|---|---|
| Portfolio A | 5.00% |
| Portfolio B | 3.50% |
| Portfolio C | 2.25% |
Excel Add-In Codes
| Name: =YCI("M:PRNHX", "name") |
| Broad Asset Class: =YCI("M:PRNHX", "broad_asset_class") |
| Broad Category: =YCI("M:PRNHX", "broad_category_group") |
| Prospectus Objective: =YCI("M:PRNHX", "prospectus_objective") |
| To find the codes for any of our securities and financial metrics, see our Complete Excel Reference. |