

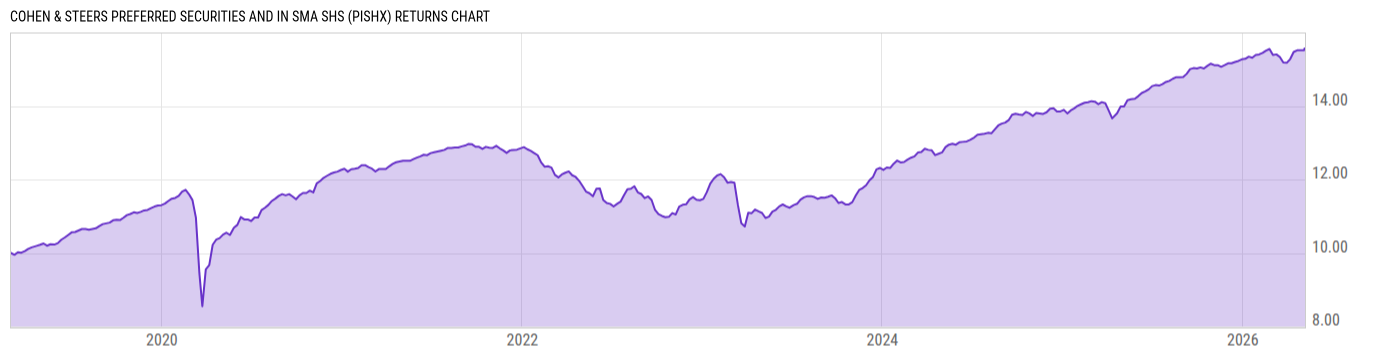
Cohen & Steers Preferred Securities and In SMA Shs (PISHX)
10.48
0.00 (0.00%)
USD |
May 28 2026
Returns Chart
Key Stats
| Net Expense Ratio | Total Assets Under Management | Weighted Average Dividend Yield | Turnover Ratio (Generic) |
|---|---|---|---|
| 0.00% | 424.30M | -- | 58.00% |
| 1 Year Fund Level Flows | 1 Year Total Returns (Daily) | Annualized Total Returns Since Inception (Daily) | Max Drawdown (Since Inception) |
| -30.40M | 9.62% |
Basic Info
| Investment Strategy | |
| The Fund seeks total return. The Fund primarily invests in issues of preferred and other income securities believed to be undervalued relative to credit quality and other investment characteristics. At least 80% of its net assets is invested in a preferred and other income securities issued by U.S. and non-U.S. companies. |
| General | |
| Security Type | Mutual Fund |
| Equity Style | -- |
| Broad Asset Class | Taxable Bond |
| Broad Category | Fixed Income |
| Global Peer Group | Bond Global USD |
| Peer Group | Flexible Income Funds |
| Global Macro | Bond Global |
| US Macro | General Domestic Taxable Fixed Income Funds |
| YCharts Categorization | -- |
| YCharts Benchmark | -- |
| Prospectus Objective | Flexible Income Funds |
| Fund Owner Firm Name | Cohen & Steers |
| Broad Asset Class Benchmark Index | |
| ^BBUSATR | 100.0% |
Net Fund Flows Versus Peer Group
1 Month
% Rank:
57
-167.79M
Peer Group Low
134.54M
Peer Group High
1 Year
% Rank:
60
-30.40M
-1.138B
Peer Group Low
1.374B
Peer Group High
3 Months
% Rank:
63
-233.65M
Peer Group Low
317.18M
Peer Group High
3 Years
% Rank:
51
-2.311B
Peer Group Low
2.293B
Peer Group High
6 Months
% Rank:
63
-1.006B
Peer Group Low
665.24M
Peer Group High
5 Years
% Rank:
44
-5.805B
Peer Group Low
3.041B
Peer Group High
YTD
% Rank:
63
-467.90M
Peer Group Low
433.25M
Peer Group High
10 Years
% Rank:
38
-11.34B
Peer Group Low
3.743B
Peer Group High
Date Unavailable
Risk
Performance Versus Peer Group
Annual Total Returns Versus Peers
As of May 29, 2026.
Asset Allocation
As of March 31, 2026.
| Type | % Net |
|---|---|
| Cash | 0.25% |
| Stock | 0.32% |
| Bond | 95.65% |
| Convertible | 0.00% |
| Preferred | 1.42% |
| Other | 2.37% |
Top 10 Holdings
| Name | % Weight | Price | % Change |
|---|---|---|---|
| Citigroup Inc. C 6.875 12/31/2099 FLT USD Corporate '30 | 1.43% | 102.05 | 0.03% |
| Bank of America Corporation BACORP 6.625 12/31/2099 FLT USD Corporate '30 | 1.40% | 103.34 | -0.02% |
| Citigroup Inc. C 6.625 12/31/2099 FLT USD Corporate '31 | 1.34% | 101.57 | 0.01% |
| Citigroup Inc. C 6.95 12/31/2099 FLT USD Corporate '30 | 1.09% | 101.98 | 0.09% |
| ING Groep N.V. INTNED 7.0 12/31/2099 FLT USD Corporate '32 | 1.01% | 103.10 | 0.07% |
| Algonquin Power & Utilities Corp. ALGOPOW 4.75 01/18/2082 FLT USD Corporate '27 | 0.98% | 99.28 | -0.01% |
| Enbridge Inc. ENB 8.5 01/15/2084 FLT USD Corporate '34 | 0.97% | 114.29 | 0.13% |
| The Goldman Sachs Group, Inc. GS 7.5 12/31/2099 FLT USD Corporate '29 | 0.97% | 104.99 | 0.34% |
|
Other Assets less Liabilities
|
0.96% | -- | -- |
| South Bow Canadian Infrastructure Holdings Ltd. SOUTBOW 7.625 03/01/2055 FLT USD Corporate '30 | 0.92% | 104.50 | -0.02% |
Fees & Availability
| Fees | |
| Actual 12B-1 Fee | -- |
| Actual Management Fee | -- |
| Administration Fee | 68.58K% |
| Maximum Front Load | -- |
| Maximum Deferred Load | -- |
| Maximum Redemption Fee | -- |
| General Availability | |
| Available for Insurance Product | No |
| Available for RRSP | No |
| Purchase Details | |
| Open to New Investors |
|
| Minimum Initial Investment | 0.00 None |
| Minimum Subsequent Investment | 0.00 None |
Basic Info
| Investment Strategy | |
| The Fund seeks total return. The Fund primarily invests in issues of preferred and other income securities believed to be undervalued relative to credit quality and other investment characteristics. At least 80% of its net assets is invested in a preferred and other income securities issued by U.S. and non-U.S. companies. |
| General | |
| Security Type | Mutual Fund |
| Equity Style | -- |
| Broad Asset Class | Taxable Bond |
| Broad Category | Fixed Income |
| Global Peer Group | Bond Global USD |
| Peer Group | Flexible Income Funds |
| Global Macro | Bond Global |
| US Macro | General Domestic Taxable Fixed Income Funds |
| YCharts Categorization | -- |
| YCharts Benchmark | -- |
| Prospectus Objective | Flexible Income Funds |
| Fund Owner Firm Name | Cohen & Steers |
| Broad Asset Class Benchmark Index | |
| ^BBUSATR | 100.0% |
Fundamentals
| General | |
| Distribution Yield | -- |
| Dividend Yield TTM (5-27-26) | 6.05% |
| 30-Day SEC Yield | -- |
| 7-Day SEC Yield | -- |
| Number of Holdings | 253 |
| Bond | |
| Yield to Maturity (3-31-26) | 6.98% |
| Effective Duration | -- |
| Average Coupon | 7.05% |
| Calculated Average Quality | 4.409 |
| Effective Maturity | 33.54 |
| Nominal Maturity | 44.63 |
| Number of Bond Holdings | 215 |
As of March 31, 2026
Fund Details
| Key Dates | |
| Inception Date | 3/1/2019 |
| Last Annual Report Date | 10/31/2025 |
| Last Prospectus Date | 3/1/2026 |
| Attributes | |
| Index Fund | -- |
| Inverse Fund | No |
| Leveraged Fund | -- |
| Fund of Funds | No |
| Currency Hedged Fund | -- |
| Socially Responsible Fund | No |
Top Portfolio Holders
| Name | % Weight |
|---|---|
| Portfolio A | 5.00% |
| Portfolio B | 3.50% |
| Portfolio C | 2.25% |
Excel Add-In Codes
| Name: =YCI("M:PISHX", "name") |
| Broad Asset Class: =YCI("M:PISHX", "broad_asset_class") |
| Broad Category: =YCI("M:PISHX", "broad_category_group") |
| Prospectus Objective: =YCI("M:PISHX", "prospectus_objective") |
| To find the codes for any of our securities and financial metrics, see our Complete Excel Reference. |