

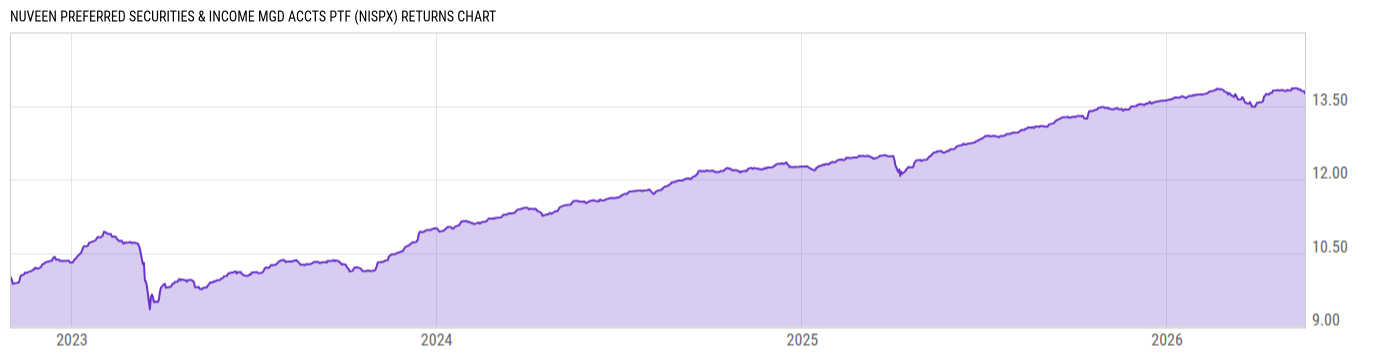
Nuveen Preferred Securities & Income Mgd Accts Ptf (NISPX)
10.17
-0.01
(-0.10%)
USD |
Jun 08 2026
Returns Chart
Key Stats
| Net Expense Ratio | Total Assets Under Management | Weighted Average Dividend Yield | Turnover Ratio (Generic) |
|---|---|---|---|
| 0.01% | 17.84M | -- | 44.00% |
| 1 Year Fund Level Flows | 1 Year Total Returns (Daily) | Annualized Total Returns Since Inception (Daily) | Max Drawdown (Since Inception) |
| -421006.0 | 9.18% |
Basic Info
| Investment Strategy | |
| The Fund seeks high level of current income and total return. It invests at least 80% of the sum of its net assets and the amount of any borrowings for investment purposes in preferred securities or other income producing securities. The Portfolio may invest in all types of preferred securities and hybrid securities. |
| General | |
| Security Type | Mutual Fund |
| Equity Style | -- |
| Broad Asset Class | Taxable Bond |
| Broad Category | Fixed Income |
| Global Peer Group | Bond USD |
| Peer Group | Flexible Income Funds |
| Global Macro | Bond HC |
| US Macro | General Domestic Taxable Fixed Income Funds |
| YCharts Categorization | -- |
| YCharts Benchmark | -- |
| Prospectus Objective | Flexible Income Funds |
| Fund Owner Firm Name | Nuveen |
| Broad Asset Class Benchmark Index | |
| ^BBUSATR | 100.0% |
Net Fund Flows Versus Peer Group
1 Month
% Rank:
49
-271.80M
Peer Group Low
249.15M
Peer Group High
1 Year
% Rank:
51
-421006.0
-1.145B
Peer Group Low
1.404B
Peer Group High
3 Months
% Rank:
46
-436.34M
Peer Group Low
366.92M
Peer Group High
3 Years
% Rank:
46
-2.320B
Peer Group Low
2.417B
Peer Group High
6 Months
% Rank:
51
-974.90M
Peer Group Low
664.10M
Peer Group High
5 Years
% Rank:
32
-5.849B
Peer Group Low
3.141B
Peer Group High
YTD
% Rank:
48
-651.97M
Peer Group Low
570.91M
Peer Group High
10 Years
% Rank:
54
-11.18B
Peer Group Low
3.681B
Peer Group High
Date Unavailable
Risk
Performance Versus Peer Group
Annual Total Returns Versus Peers
As of June 09, 2026.
Asset Allocation
As of April 30, 2026.
| Type | % Net |
|---|---|
| Cash | 0.60% |
| Stock | 0.00% |
| Bond | 97.50% |
| Convertible | 0.00% |
| Preferred | 0.00% |
| Other | 1.90% |
Top 10 Holdings
| Name | % Weight | Price | % Change |
|---|---|---|---|
|
State Street Navigator Securities Lending Government Money Market Portfolio
|
7.55% | -- | -- |
| CoBank, ACB COBANK 6.45 12/31/2099 FLT USD Agency 144A '27 | 3.01% | 100.42 | 0.10% |
| Bank of America Corporation BACORP 6.625 12/31/2099 FLT USD Corporate '30 | 2.88% | 103.08 | -0.05% |
| UBS Group AG UBSGRO 9.25 12/31/2099 FLT USD Corporate 144A '28 | 2.42% | 107.54 | -0.03% |
|
ING Groep NV 7.5%
|
2.31% | -- | -- |
| MetLife, Inc. MET 9.25 04/08/2068 FLT USD Corporate 144A '38 | 2.14% | 116.96 | 0.15% |
| JPMorgan Chase & Co. JPM 6.5 12/31/2099 FLT USD Corporate '30 | 1.98% | 102.28 | -0.13% |
| Barclays PLC BACR 9.625 12/31/2099 FLT USD Corporate '30 | 1.96% | 110.39 | -0.07% |
| The Goldman Sachs Group, Inc. GS 6.125 12/31/2099 FLT USD Corporate '34 | 1.87% | 100.44 | -0.02% |
| Vistra Corp. VISTCOR 7.0 12/31/2099 FLT USD Corporate 144A '26 | 1.82% | 100.67 | 0.03% |
Fees & Availability
| Fees | |
| Actual 12B-1 Fee | -- |
| Actual Management Fee | -- |
| Administration Fee | -- |
| Maximum Front Load | -- |
| Maximum Deferred Load | -- |
| Maximum Redemption Fee | -- |
| General Availability | |
| Available for Insurance Product | No |
| Available for RRSP | No |
| Purchase Details | |
| Open to New Investors |
|
| Minimum Initial Investment | 0.00 None |
| Minimum Subsequent Investment | 0.00 None |
Basic Info
| Investment Strategy | |
| The Fund seeks high level of current income and total return. It invests at least 80% of the sum of its net assets and the amount of any borrowings for investment purposes in preferred securities or other income producing securities. The Portfolio may invest in all types of preferred securities and hybrid securities. |
| General | |
| Security Type | Mutual Fund |
| Equity Style | -- |
| Broad Asset Class | Taxable Bond |
| Broad Category | Fixed Income |
| Global Peer Group | Bond USD |
| Peer Group | Flexible Income Funds |
| Global Macro | Bond HC |
| US Macro | General Domestic Taxable Fixed Income Funds |
| YCharts Categorization | -- |
| YCharts Benchmark | -- |
| Prospectus Objective | Flexible Income Funds |
| Fund Owner Firm Name | Nuveen |
| Broad Asset Class Benchmark Index | |
| ^BBUSATR | 100.0% |
Fundamentals
| General | |
| Distribution Yield | -- |
| Dividend Yield TTM (6-5-26) | 7.02% |
| 30-Day SEC Yield (5-31-26) | 6.34% |
| 7-Day SEC Yield | -- |
| Number of Holdings | 101 |
| Bond | |
| Yield to Maturity (4-30-26) | 6.10% |
| Effective Duration | -- |
| Average Coupon | 7.41% |
| Calculated Average Quality | 4.500 |
| Effective Maturity | 38.76 |
| Nominal Maturity | 54.10 |
| Number of Bond Holdings | 94 |
As of April 30, 2026
Fund Details
| Key Dates | |
| Inception Date | 11/1/2022 |
| Last Annual Report Date | 7/31/2025 |
| Last Prospectus Date | 11/28/2025 |
| Attributes | |
| Index Fund | -- |
| Inverse Fund | No |
| Leveraged Fund | -- |
| Fund of Funds | No |
| Currency Hedged Fund | -- |
| Socially Responsible Fund | No |
Top Portfolio Holders
| Name | % Weight |
|---|---|
| Portfolio A | 5.00% |
| Portfolio B | 3.50% |
| Portfolio C | 2.25% |
Excel Add-In Codes
| Name: =YCI("M:NISPX", "name") |
| Broad Asset Class: =YCI("M:NISPX", "broad_asset_class") |
| Broad Category: =YCI("M:NISPX", "broad_category_group") |
| Prospectus Objective: =YCI("M:NISPX", "prospectus_objective") |
| To find the codes for any of our securities and financial metrics, see our Complete Excel Reference. |