

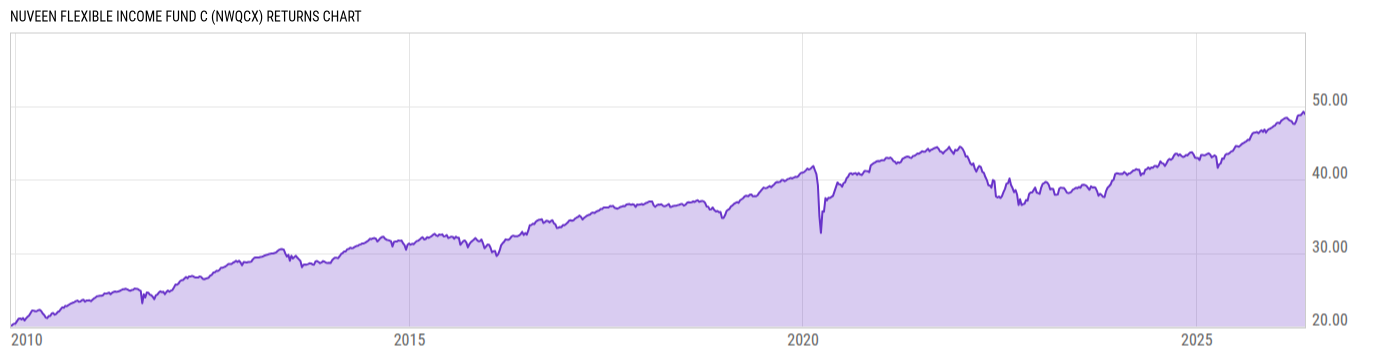
Nuveen Flexible Income Fund C (NWQCX)
20.11
-0.01
(-0.05%)
USD |
Jun 08 2026
Returns Chart
Key Stats
| Net Expense Ratio | Total Assets Under Management | Weighted Average Dividend Yield | Turnover Ratio (Generic) |
|---|---|---|---|
| 1.71% | 818.63M | -- | 27.00% |
| 1 Year Fund Level Flows | 1 Year Total Returns (Daily) | Annualized Total Returns Since Inception (Daily) | Max Drawdown (Since Inception) |
| -143.27M | 12.75% |
Basic Info
| Investment Strategy | |
| The Fund seeks to provide current income and capital appreciation. The Fund invests at least 80% of its net assets in income producing securities.The Fund invests at least 65% of its net assets in preferred and debt securities which include corporate debt securities and US Government and agency debt securities. |
| General | |
| Security Type | Mutual Fund |
| Equity Style | -- |
| Broad Asset Class | Taxable Bond |
| Broad Category | Fixed Income |
| Global Peer Group | Bond USD |
| Peer Group | Flexible Income Funds |
| Global Macro | Bond HC |
| US Macro | General Domestic Taxable Fixed Income Funds |
| YCharts Categorization | -- |
| YCharts Benchmark | -- |
| Prospectus Objective | Flexible Income Funds |
| Fund Owner Firm Name | Nuveen |
| Broad Asset Class Benchmark Index | |
| ^BBUSATR | 100.0% |
Net Fund Flows Versus Peer Group
1 Month
% Rank:
28
-271.80M
Peer Group Low
249.15M
Peer Group High
1 Year
% Rank:
77
-143.27M
-1.145B
Peer Group Low
1.404B
Peer Group High
3 Months
% Rank:
72
-436.34M
Peer Group Low
366.92M
Peer Group High
3 Years
% Rank:
79
-2.320B
Peer Group Low
2.417B
Peer Group High
6 Months
% Rank:
72
-974.90M
Peer Group Low
664.10M
Peer Group High
5 Years
% Rank:
74
-5.849B
Peer Group Low
3.141B
Peer Group High
YTD
% Rank:
71
-651.97M
Peer Group Low
570.91M
Peer Group High
10 Years
% Rank:
46
-11.18B
Peer Group Low
3.681B
Peer Group High
Date Unavailable
Risk
Performance Versus Peer Group
Annual Total Returns Versus Peers
As of June 09, 2026.
Asset Allocation
As of April 30, 2026.
| Type | % Net |
|---|---|
| Cash | 2.50% |
| Stock | 10.07% |
| Bond | 76.06% |
| Convertible | 0.00% |
| Preferred | 6.80% |
| Other | 4.57% |
Top 10 Holdings
| Name | % Weight | Price | % Change |
|---|---|---|---|
| Vistra Corp. VISTCOR 8.0 12/31/2099 FLT USD Corporate 144A '26 | 2.56% | 100.74 | -0.11% |
|
Fixed Income Clearing Corp Repo
|
2.50% | -- | -- |
|
State Street Navigator Securities Lending Government Money Market Portfolio
|
2.26% | -- | -- |
| Citigroup Inc. C 6.625 12/31/2099 FLT USD Corporate '31 | 1.78% | 101.27 | -0.06% |
| ENERGY TRANSFER LP ENERTRAE 8.0 05/15/2054 FLT USD Corporate '29 | 1.74% | 106.13 | -0.00% |
| Wells Fargo & Company WFC 7.5 12/31/2099 FIX USD Corporate | 1.69% | 1174.76 | 0.00% |
| NRG Energy, Inc. XEL-NRGInc 10.25 12/31/2099 FLT USD Corporate 144A '28 | 1.59% | 108.89 | 0.25% |
| The Goldman Sachs Group, Inc. GS 7.5 12/31/2099 FLT USD Corporate '29 | 1.51% | 105.13 | 0.19% |
| COLUMBIA PIPELINES OPERATING COMPANY LLC CPIPEL 6.544 11/15/2053 FIX USD Corporate 144A | 1.43% | 106.13 | 0.47% |
| Liberty Mutual Group Inc. LIB 7.8 03/07/2087 FLT USD Corporate 144A '37 | 1.42% | 111.58 | -0.23% |
Fees & Availability
| Fees | |
| Actual 12B-1 Fee | 1.00% |
| Actual Management Fee | 0.61% |
| Administration Fee | -- |
| Maximum Front Load | -- |
| Maximum Deferred Load | 1.00% |
| Maximum Redemption Fee | -- |
| General Availability | |
| Available for Insurance Product | No |
| Available for RRSP | No |
| Purchase Details | |
| Open to New Investors |
|
| Minimum Initial Investment | 2500.00 None |
| Minimum Subsequent Investment | 100.00 None |
Basic Info
| Investment Strategy | |
| The Fund seeks to provide current income and capital appreciation. The Fund invests at least 80% of its net assets in income producing securities.The Fund invests at least 65% of its net assets in preferred and debt securities which include corporate debt securities and US Government and agency debt securities. |
| General | |
| Security Type | Mutual Fund |
| Equity Style | -- |
| Broad Asset Class | Taxable Bond |
| Broad Category | Fixed Income |
| Global Peer Group | Bond USD |
| Peer Group | Flexible Income Funds |
| Global Macro | Bond HC |
| US Macro | General Domestic Taxable Fixed Income Funds |
| YCharts Categorization | -- |
| YCharts Benchmark | -- |
| Prospectus Objective | Flexible Income Funds |
| Fund Owner Firm Name | Nuveen |
| Broad Asset Class Benchmark Index | |
| ^BBUSATR | 100.0% |
Fundamentals
| General | |
| Distribution Yield | -- |
| Dividend Yield TTM (6-5-26) | 4.58% |
| 30-Day SEC Yield (5-31-26) | 3.70% |
| 7-Day SEC Yield | -- |
| Number of Holdings | 185 |
| Stock | |
| Weighted Average PE Ratio | -- |
| Weighted Average Price to Sales Ratio | -- |
| Weighted Average Price to Book Ratio | -- |
| Weighted Median ROE | -- |
| Weighted Median ROA | -- |
| ROI (TTM) | -- |
| Return on Investment (TTM) | -- |
| Earning Yield | -- |
| LT Debt / Shareholders Equity | -- |
| Number of Equity Holdings | 61 |
| Bond | |
| Yield to Maturity (4-30-26) | 6.51% |
| Effective Duration | 3.36 |
| Average Coupon | 7.10% |
| Calculated Average Quality | 4.729 |
| Effective Maturity | 15.25 |
| Nominal Maturity | 20.74 |
| Number of Bond Holdings | 111 |
As of April 30, 2026
Growth Metrics
| EPS Growth (1Y) | -- |
| EPS Growth (3Y) | -- |
| EPS Growth (5Y) | -- |
| Sales Growth (1Y) | -- |
| Sales Growth (3Y) | -- |
| Sales Growth (5Y) | -- |
| Sales per Share Growth (1Y) | -- |
| Sales per Share Growth (3Y) | -- |
| Operating Cash Flow - Growth Rate (3Y) | -- |
As of April 30, 2026
Top Portfolio Holders
| Name | % Weight |
|---|---|
| Portfolio A | 5.00% |
| Portfolio B | 3.50% |
| Portfolio C | 2.25% |
Excel Add-In Codes
| Name: =YCI("M:NWQCX", "name") |
| Broad Asset Class: =YCI("M:NWQCX", "broad_asset_class") |
| Broad Category: =YCI("M:NWQCX", "broad_category_group") |
| Prospectus Objective: =YCI("M:NWQCX", "prospectus_objective") |
| To find the codes for any of our securities and financial metrics, see our Complete Excel Reference. |