

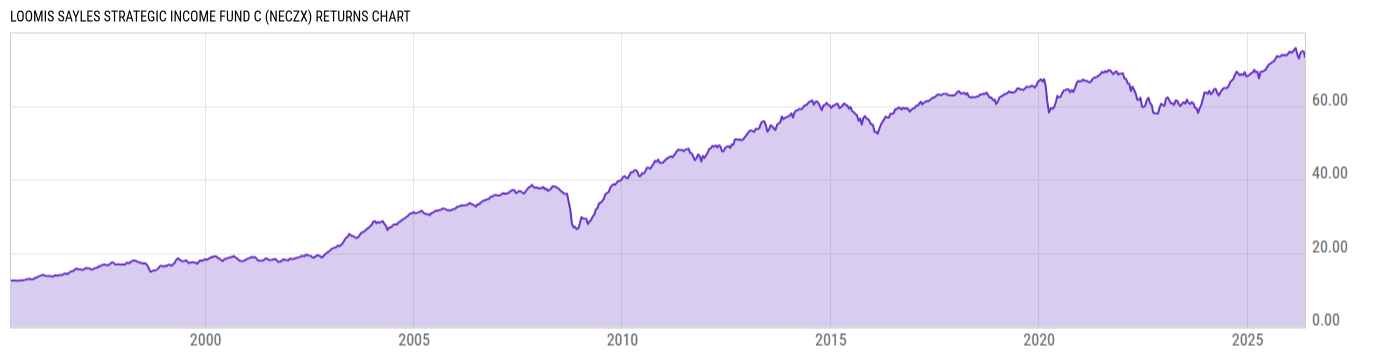
Loomis Sayles Strategic Income Fund C (NECZX)
12.42
-0.01
(-0.08%)
USD |
Jun 08 2026
Returns Chart
Key Stats
| Net Expense Ratio | Total Assets Under Management | Weighted Average Dividend Yield | Turnover Ratio (Generic) |
|---|---|---|---|
| 1.67% | 2.673B | -- | 100.0% |
| 1 Year Fund Level Flows | 1 Year Total Returns (Daily) | Annualized Total Returns Since Inception (Daily) | Max Drawdown (Since Inception) |
| -53.04M | 5.92% |
Basic Info
| Investment Strategy | |
| The Fund seeks high current income with a secondary objective of capital growth. Under normal market conditions, the Fund will invest substantially all of its assets in income producing securities with a focus on U.S. corporate bonds, convertible securities, foreign debt instruments, including those in emerging markets. |
| General | |
| Security Type | Mutual Fund |
| Equity Style | -- |
| Broad Asset Class | Taxable Bond |
| Broad Category | Fixed Income |
| Global Peer Group | Bond USD |
| Peer Group | Flexible Income Funds |
| Global Macro | Bond HC |
| US Macro | General Domestic Taxable Fixed Income Funds |
| YCharts Categorization | -- |
| YCharts Benchmark | -- |
| Prospectus Objective | Flexible Income Funds |
| Fund Owner Firm Name | Loomis Sayles |
| Broad Asset Class Benchmark Index | |
| ^BBUSATR | 100.0% |
Net Fund Flows Versus Peer Group
1 Month
% Rank:
75
-271.80M
Peer Group Low
249.15M
Peer Group High
1 Year
% Rank:
67
-53.04M
-1.145B
Peer Group Low
1.404B
Peer Group High
3 Months
% Rank:
67
-436.34M
Peer Group Low
366.92M
Peer Group High
3 Years
% Rank:
84
-2.320B
Peer Group Low
2.417B
Peer Group High
6 Months
% Rank:
66
-974.90M
Peer Group Low
664.10M
Peer Group High
5 Years
% Rank:
85
-5.849B
Peer Group Low
3.141B
Peer Group High
YTD
% Rank:
62
-651.97M
Peer Group Low
570.91M
Peer Group High
10 Years
% Rank:
99
-11.18B
Peer Group Low
3.681B
Peer Group High
Date Unavailable
Risk
Performance Versus Peer Group
Annual Total Returns Versus Peers
As of June 09, 2026.
Asset Allocation
As of January 31, 2026.
| Type | % Net |
|---|---|
| Cash | 3.95% |
| Stock | 5.78% |
| Bond | 84.82% |
| Convertible | 0.00% |
| Preferred | 0.34% |
| Other | 5.12% |
Top 10 Holdings
| Name | % Weight | Price | % Change |
|---|---|---|---|
| United States of America USGB 4.0 03/31/2030 FIX USD Government | 7.01% | 99.22 | 0.12% |
|
FIXED INCOME CLEARING CORP REPO
|
3.38% | -- | -- |
| United States of America USGB 3.5 11/30/2030 FIX USD Government | 1.98% | 96.98 | 0.15% |
|
SOUTH AFRICA, REPUBLIC OF (GOVERNMENT) 9% 31-JAN-2040
|
1.64% | -- | -- |
|
SERVICENOW INC/BARCLAYS BANK PLC ELN
|
1.26% | -- | -- |
|
BNP PARIBAS ISSUANCE BV ELN
|
1.16% | -- | -- |
| EchoStar Corporation ECHO 10.75 11/30/2029 FIX USD Corporate | 1.05% | 108.42 | -0.05% |
| NATIONAL LIFE INSURANCE COMPANY NLFIC 10.5 09/15/2039 FIX USD Corporate 144A | 0.98% | 129.23 | 0.77% |
|
MEXICO (UNITED MEXICAN STATES) (GOVERNMENT) 8% 31-JUL-2053
|
0.96% | -- | -- |
| EchoStar Corporation ECHO 6.75 11/30/2030 FIX USD Corporate | 0.87% | 101.95 | 0.03% |
Fees & Availability
| Fees | |
| Actual 12B-1 Fee | 1.00% |
| Actual Management Fee | 0.50% |
| Administration Fee | 10.39K% |
| Maximum Front Load | 0.00% |
| Maximum Deferred Load | 1.00% |
| Maximum Redemption Fee | -- |
| General Availability | |
| Available for Insurance Product | No |
| Available for RRSP | No |
| Purchase Details | |
| Open to New Investors |
|
| Minimum Initial Investment | 2500.00 None |
| Minimum Subsequent Investment | 50.00 None |
Basic Info
| Investment Strategy | |
| The Fund seeks high current income with a secondary objective of capital growth. Under normal market conditions, the Fund will invest substantially all of its assets in income producing securities with a focus on U.S. corporate bonds, convertible securities, foreign debt instruments, including those in emerging markets. |
| General | |
| Security Type | Mutual Fund |
| Equity Style | -- |
| Broad Asset Class | Taxable Bond |
| Broad Category | Fixed Income |
| Global Peer Group | Bond USD |
| Peer Group | Flexible Income Funds |
| Global Macro | Bond HC |
| US Macro | General Domestic Taxable Fixed Income Funds |
| YCharts Categorization | -- |
| YCharts Benchmark | -- |
| Prospectus Objective | Flexible Income Funds |
| Fund Owner Firm Name | Loomis Sayles |
| Broad Asset Class Benchmark Index | |
| ^BBUSATR | 100.0% |
Fundamentals
| General | |
| Distribution Yield | -- |
| Dividend Yield TTM (6-5-26) | 4.88% |
| 30-Day SEC Yield (4-30-26) | 5.06% |
| 7-Day SEC Yield (7-31-22) | 4.11% |
| Number of Holdings | 607 |
| Stock | |
| Weighted Average PE Ratio | -- |
| Weighted Average Price to Sales Ratio | -- |
| Weighted Average Price to Book Ratio | -- |
| Weighted Median ROE | -- |
| Weighted Median ROA | -- |
| ROI (TTM) | -- |
| Return on Investment (TTM) | -- |
| Earning Yield | -- |
| LT Debt / Shareholders Equity | -- |
| Number of Equity Holdings | 63 |
| Bond | |
| Yield to Maturity (1-31-26) | 5.50% |
| Effective Duration | 5.25 |
| Average Coupon | 6.39% |
| Calculated Average Quality | 4.487 |
| Effective Maturity | 8.405 |
| Nominal Maturity | 9.091 |
| Number of Bond Holdings | 490 |
As of January 31, 2026
Growth Metrics
| EPS Growth (1Y) | -- |
| EPS Growth (3Y) | -- |
| EPS Growth (5Y) | -- |
| Sales Growth (1Y) | -- |
| Sales Growth (3Y) | -- |
| Sales Growth (5Y) | -- |
| Sales per Share Growth (1Y) | -- |
| Sales per Share Growth (3Y) | -- |
| Operating Cash Flow - Growth Rate (3Y) | -- |
As of January 31, 2026
Fund Details
Top Portfolio Holders
| Name | % Weight |
|---|---|
| Portfolio A | 5.00% |
| Portfolio B | 3.50% |
| Portfolio C | 2.25% |
Excel Add-In Codes
| Name: =YCI("M:NECZX", "name") |
| Broad Asset Class: =YCI("M:NECZX", "broad_asset_class") |
| Broad Category: =YCI("M:NECZX", "broad_category_group") |
| Prospectus Objective: =YCI("M:NECZX", "prospectus_objective") |
| To find the codes for any of our securities and financial metrics, see our Complete Excel Reference. |