

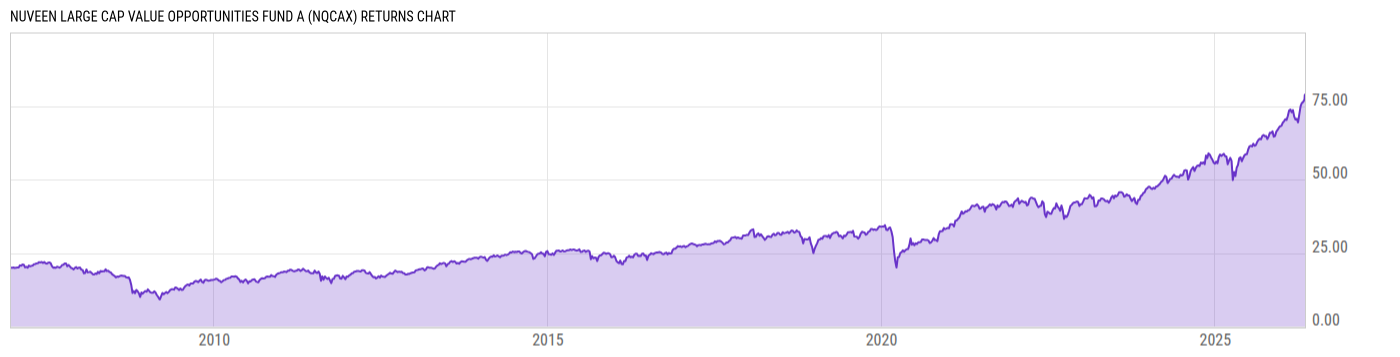
Nuveen Large Cap Value Opportunities Fund A (NQCAX)
6.42
-0.04
(-0.62%)
USD |
May 29 2026
Returns Chart
Key Stats
| Net Expense Ratio | Total Assets Under Management | Weighted Average Dividend Yield | Turnover Ratio (Generic) |
|---|---|---|---|
| 1.00% | 69.97M | 2.01% | 25.00% |
| 1 Year Fund Level Flows | 1 Year Total Returns (Daily) | Annualized Total Returns Since Inception (Daily) | Max Drawdown (Since Inception) |
| 38.71M | 37.84% |
Basic Info
| Investment Strategy | |
| The Fund seeks to provide investors with long-term capital appreciation. Under normal market conditions, at least 80% of the Fund's net assets will be invested in equity securities of companies with market capitalizations at the time of investment comparable to companies in the Russell 1000 Index. |
| General | |
| Security Type | Mutual Fund |
| Equity Style | Multi Cap Value |
| Broad Asset Class | US Equity |
| Broad Category | Equity |
| Global Peer Group | Equity US |
| Peer Group | Multi-Cap Value Funds |
| Global Macro | Equity North America |
| US Macro | Multi-Cap Funds |
| YCharts Categorization | -- |
| YCharts Benchmark | -- |
| Prospectus Objective | Growth & Income Funds |
| Fund Owner Firm Name | Nuveen |
| Broad Asset Class Benchmark Index | |
| ^SPXTR | 100.0% |
Net Fund Flows Versus Peer Group
1 Month
% Rank:
6
-1.190B
Peer Group Low
1.579B
Peer Group High
1 Year
% Rank:
14
38.71M
-8.341B
Peer Group Low
7.542B
Peer Group High
3 Months
% Rank:
11
-2.558B
Peer Group Low
2.814B
Peer Group High
3 Years
% Rank:
18
-15.39B
Peer Group Low
11.11B
Peer Group High
6 Months
% Rank:
13
-6.079B
Peer Group Low
5.372B
Peer Group High
5 Years
% Rank:
20
-13.92B
Peer Group Low
35.39B
Peer Group High
YTD
% Rank:
16
-3.543B
Peer Group Low
2.810B
Peer Group High
10 Years
% Rank:
34
-32.35B
Peer Group Low
73.88B
Peer Group High
Date Unavailable
Risk
Performance Versus Peer Group
Annual Total Returns Versus Peers
As of May 30, 2026.
Asset Allocation
As of March 31, 2026.
| Type | % Net |
|---|---|
| Cash | 3.10% |
| Stock | 97.49% |
| Bond | 0.00% |
| Convertible | 0.00% |
| Preferred | 0.00% |
| Other | -0.59% |
Top 10 Holdings
| Name | % Weight | Price | % Change |
|---|---|---|---|
|
FIXED INCOME CLEARING CORP REPO
|
7.15% | -- | -- |
| Intel Corp. | 3.28% | 114.68 | -5.14% |
| Citigroup, Inc. | 3.27% | 125.90 | 0.98% |
| Flowserve Corp. | 2.70% | 75.51 | 0.40% |
| Alphabet, Inc. | 2.67% | 380.34 | -2.51% |
| Cheniere Energy, Inc. | 2.56% | 224.86 | -2.05% |
| Wells Fargo & Co. | 2.46% | 77.54 | 1.16% |
| JPMorgan Chase & Co. | 2.45% | 299.31 | 0.87% |
| General Motors Co. | 2.32% | 83.24 | -1.32% |
| ViaSat, Inc. | 2.28% | 80.62 | -7.00% |
Fees & Availability
| Fees | |
| Actual 12B-1 Fee | 0.25% |
| Actual Management Fee | 0.06% |
| Administration Fee | -- |
| Maximum Front Load | 5.75% |
| Maximum Deferred Load | -- |
| Maximum Redemption Fee | -- |
| General Availability | |
| Available for Insurance Product | -- |
| Available for RRSP | -- |
| Purchase Details | |
| Open to New Investors |
|
| Minimum Initial Investment | 2500.00 None |
| Minimum Subsequent Investment | 100.00 None |
Basic Info
| Investment Strategy | |
| The Fund seeks to provide investors with long-term capital appreciation. Under normal market conditions, at least 80% of the Fund's net assets will be invested in equity securities of companies with market capitalizations at the time of investment comparable to companies in the Russell 1000 Index. |
| General | |
| Security Type | Mutual Fund |
| Equity Style | Multi Cap Value |
| Broad Asset Class | US Equity |
| Broad Category | Equity |
| Global Peer Group | Equity US |
| Peer Group | Multi-Cap Value Funds |
| Global Macro | Equity North America |
| US Macro | Multi-Cap Funds |
| YCharts Categorization | -- |
| YCharts Benchmark | -- |
| Prospectus Objective | Growth & Income Funds |
| Fund Owner Firm Name | Nuveen |
| Broad Asset Class Benchmark Index | |
| ^SPXTR | 100.0% |
Fundamentals
| General | |
| Distribution Yield | -- |
| Dividend Yield TTM (5-28-26) | 0.88% |
| 30-Day SEC Yield (4-30-26) | 0.90% |
| 7-Day SEC Yield | -- |
| Number of Holdings | 10 |
| Stock | |
| Weighted Average PE Ratio | 24.45 |
| Weighted Average Price to Sales Ratio | 3.018 |
| Weighted Average Price to Book Ratio | 4.039 |
| Weighted Median ROE | 22.47% |
| Weighted Median ROA | 5.85% |
| ROI (TTM) | 11.94% |
| Return on Investment (TTM) | 11.94% |
| Earning Yield | 0.0520 |
| LT Debt / Shareholders Equity | 1.053 |
| Number of Equity Holdings | 9 |
As of March 31, 2026
Growth Metrics
| EPS Growth (1Y) | 30.05% |
| EPS Growth (3Y) | 4.69% |
| EPS Growth (5Y) | 15.69% |
| Sales Growth (1Y) | 7.39% |
| Sales Growth (3Y) | 6.49% |
| Sales Growth (5Y) | 8.93% |
| Sales per Share Growth (1Y) | 7.35% |
| Sales per Share Growth (3Y) | 6.03% |
| Operating Cash Flow - Growth Rate (3Y) | 10.88% |
As of March 31, 2026
Fund Details
Top Portfolio Holders
| Name | % Weight |
|---|---|
| Portfolio A | 5.00% |
| Portfolio B | 3.50% |
| Portfolio C | 2.25% |
Excel Add-In Codes
| Name: =YCI("M:NQCAX", "name") |
| Broad Asset Class: =YCI("M:NQCAX", "broad_asset_class") |
| Broad Category: =YCI("M:NQCAX", "broad_category_group") |
| Prospectus Objective: =YCI("M:NQCAX", "prospectus_objective") |
| To find the codes for any of our securities and financial metrics, see our Complete Excel Reference. |