

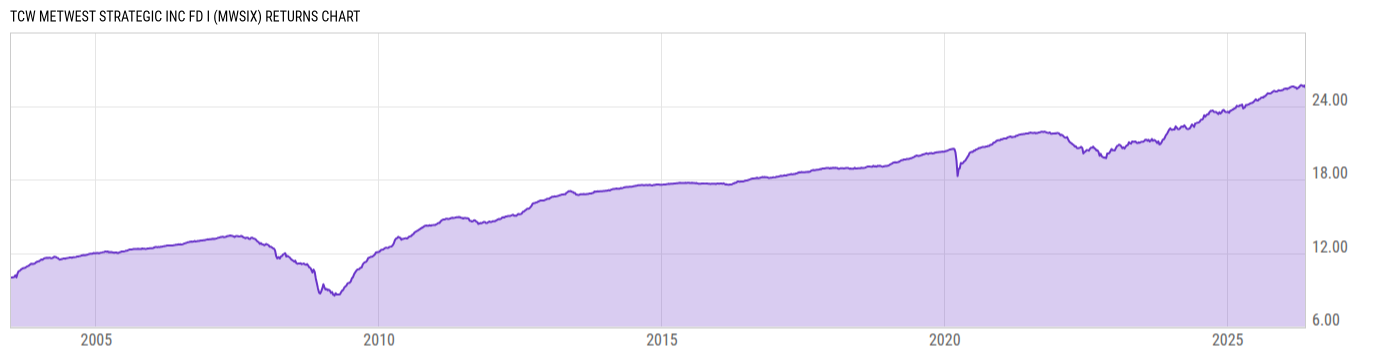
TCW MetWest Strategic Inc Fd I (MWSIX)
6.14
+0.01
(+0.16%)
USD |
Jun 09 2026
Returns Chart
Key Stats
| Net Expense Ratio | Total Assets Under Management | Weighted Average Dividend Yield | Turnover Ratio (Generic) |
|---|---|---|---|
| 0.80% | 57.70M | -- | -- |
| 1 Year Fund Level Flows | 1 Year Total Returns (Daily) | Annualized Total Returns Since Inception (Daily) | Max Drawdown (Since Inception) |
| -8.941M | 5.85% |
Basic Info
| Investment Strategy | |
| The Fund seeks to maximize long-term total return without tracking any particular markets or indices. The Strategic Income Fund uses strategies intended to provide absolute (positive) returns in all markets by employing a strategy intended to produce high income while exploiting disparities or inefficiencies in markets. |
| General | |
| Security Type | Mutual Fund |
| Equity Style | -- |
| Broad Asset Class | Taxable Bond |
| Broad Category | Alternative Strategies |
| Global Peer Group | Absolute Return Bond USD |
| Peer Group | Absolute Return Bond Funds |
| Global Macro | Alternative Bond |
| US Macro | Alternative Bond Funds |
| YCharts Categorization | -- |
| YCharts Benchmark | -- |
| Prospectus Objective | Absolute Return Bond Funds |
| Fund Owner Firm Name | TCW Funds |
| Broad Asset Class Benchmark Index | |
| ^BBUSATR | 100.0% |
Net Fund Flows Versus Peer Group
1 Month
% Rank:
52
-209.47M
Peer Group Low
154.84M
Peer Group High
1 Year
% Rank:
52
-8.941M
-1.520B
Peer Group Low
1.173B
Peer Group High
3 Months
% Rank:
40
-434.27M
Peer Group Low
314.37M
Peer Group High
3 Years
% Rank:
52
-797.94M
Peer Group Low
4.557B
Peer Group High
6 Months
% Rank:
55
-735.93M
Peer Group Low
552.16M
Peer Group High
5 Years
% Rank:
43
-2.546B
Peer Group Low
4.706B
Peer Group High
YTD
% Rank:
61
-521.26M
Peer Group Low
591.05M
Peer Group High
10 Years
% Rank:
71
-6.734B
Peer Group Low
9.278B
Peer Group High
Date Unavailable
Risk
Performance Versus Peer Group
Annual Total Returns Versus Peers
As of June 10, 2026.
Asset Allocation
As of April 30, 2026.
| Type | % Net |
|---|---|
| Cash | 1.06% |
| Stock | 0.25% |
| Bond | 82.48% |
| Convertible | 0.00% |
| Preferred | 0.00% |
| Other | 16.21% |
Top 10 Holdings
| Name | % Weight | Price | % Change |
|---|---|---|---|
|
TCW Central Cash Money Market Fund
|
14.42% | -- | -- |
|
United States of America (Government) 3.75% 30-APR-2028
|
4.88% | -- | -- |
|
Federal National Mortgage Association 3.5% 01-MAY-2056
|
3.13% | -- | -- |
| FEDERAL NATIONAL MORTGAGE ASSOCIATION FNMA-New 05/15/2035 FIX USD Agency | 2.76% | 96.43 | -0.12% |
| United States of America USGB 3.875 03/31/2028 FIX USD Government | 2.74% | 99.56 | 0.06% |
| TCW Private Asset Income Fund I | 1.69% | 9.98 | 0.00% |
|
Federal National Mortgage Association 5% 01-MAY-2056
|
1.58% | -- | -- |
|
Government National Mortgage Association 2 4% 01-MAY-2056
|
1.50% | -- | -- |
|
United States of America (Government) 3.875% 30-APR-2031
|
1.47% | -- | -- |
| FNMA-New 05/01/2039 FIX USD Agency | 1.35% | 93.97 | -0.17% |
Fees & Availability
| Fees | |
| Actual 12B-1 Fee | -- |
| Actual Management Fee | 0.19% |
| Administration Fee | 58.41K% |
| Maximum Front Load | -- |
| Maximum Deferred Load | -- |
| Maximum Redemption Fee | -- |
| General Availability | |
| Available for Insurance Product | No |
| Available for RRSP | No |
| Purchase Details | |
| Open to New Investors |
|
| Minimum Initial Investment | 3.00M None |
| Minimum Subsequent Investment | 50000.00 None |
Basic Info
| Investment Strategy | |
| The Fund seeks to maximize long-term total return without tracking any particular markets or indices. The Strategic Income Fund uses strategies intended to provide absolute (positive) returns in all markets by employing a strategy intended to produce high income while exploiting disparities or inefficiencies in markets. |
| General | |
| Security Type | Mutual Fund |
| Equity Style | -- |
| Broad Asset Class | Taxable Bond |
| Broad Category | Alternative Strategies |
| Global Peer Group | Absolute Return Bond USD |
| Peer Group | Absolute Return Bond Funds |
| Global Macro | Alternative Bond |
| US Macro | Alternative Bond Funds |
| YCharts Categorization | -- |
| YCharts Benchmark | -- |
| Prospectus Objective | Absolute Return Bond Funds |
| Fund Owner Firm Name | TCW Funds |
| Broad Asset Class Benchmark Index | |
| ^BBUSATR | 100.0% |
Fundamentals
| General | |
| Distribution Yield | -- |
| Dividend Yield TTM (6-8-26) | 5.62% |
| 30-Day SEC Yield (5-31-26) | 5.17% |
| 7-Day SEC Yield | -- |
| Number of Holdings | 503 |
| Bond | |
| Yield to Maturity (4-30-26) | 5.46% |
| Effective Duration | 2.21 |
| Average Coupon | 4.82% |
| Calculated Average Quality | 3.703 |
| Effective Maturity | 14.83 |
| Nominal Maturity | 14.89 |
| Number of Bond Holdings | 467 |
As of April 30, 2026
Fund Details
| Key Dates | |
| Inception Date | 6/30/2003 |
| Last Annual Report Date | 3/31/2025 |
| Last Prospectus Date | 7/29/2025 |
| Share Classes | |
| MWSTX | M |
| Attributes | |
| Index Fund | -- |
| Inverse Fund | No |
| Leveraged Fund | -- |
| Fund of Funds | No |
| Currency Hedged Fund | -- |
| Socially Responsible Fund | No |
Top Portfolio Holders
| Name | % Weight |
|---|---|
| Portfolio A | 5.00% |
| Portfolio B | 3.50% |
| Portfolio C | 2.25% |
Excel Add-In Codes
| Name: =YCI("M:MWSIX", "name") |
| Broad Asset Class: =YCI("M:MWSIX", "broad_asset_class") |
| Broad Category: =YCI("M:MWSIX", "broad_category_group") |
| Prospectus Objective: =YCI("M:MWSIX", "prospectus_objective") |
| To find the codes for any of our securities and financial metrics, see our Complete Excel Reference. |