

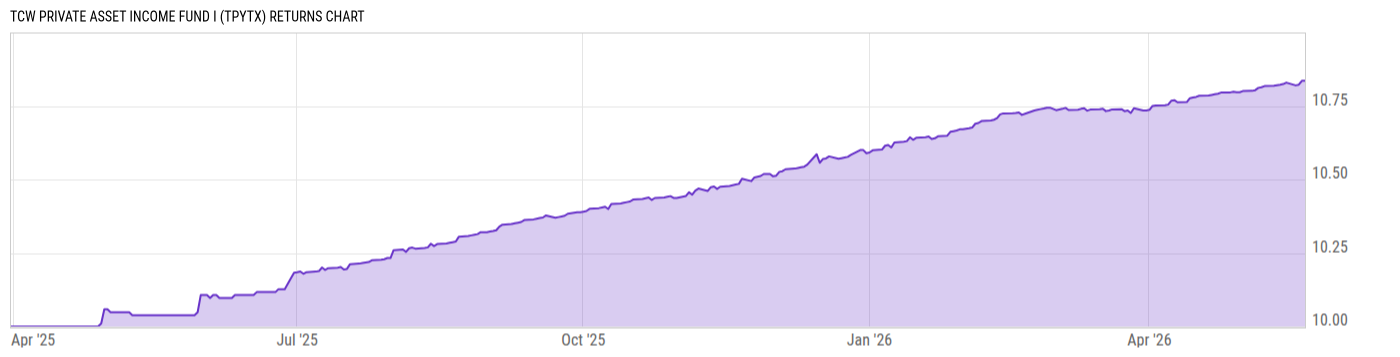
TCW Private Asset Income Fund I (TPYTX)
9.98
+0.01
(+0.10%)
USD |
Jun 08 2026
Returns Chart
Key Stats
| Net Expense Ratio | Total Assets Under Management | Weighted Average Dividend Yield | Turnover Ratio (Generic) |
|---|---|---|---|
| 1.38% | 486.81M | -- | 26.00% |
| 1 Year Fund Level Flows | 1 Year Total Returns (Daily) | Annualized Total Returns Since Inception (Daily) | Max Drawdown (Since Inception) |
| -- | 7.60% |
Basic Info
| Investment Strategy | |
| The Fund seeks to provide attractive risk-adjusted returns and produce current income. It seeks to achieve its objective primarily by allocating its assets across a wide range of private credit strategies, with a focus on asset-backed credit strategies. It invest at least 80% of its net assets in private credit investment |
| General | |
| Security Type | Unlisted Closed-End Fund |
| Equity Style | -- |
| Broad Asset Class | Taxable Bond |
| Broad Category | Fixed Income |
| Global Peer Group | Bond USD |
| Peer Group | General Bond Funds |
| Global Macro | Bond HC |
| US Macro | General Domestic Taxable Fixed Income Funds |
| YCharts Categorization | -- |
| YCharts Benchmark | -- |
| Prospectus Objective | General Bond Funds |
| Fund Owner Firm Name | TCW Funds |
| Broad Asset Class Benchmark Index | |
| ^BBUSATR | 100.0% |
Net Fund Flows Versus Peer Group
1 Month
% Rank:
--
-3.511B
Peer Group Low
3.098B
Peer Group High
1 Year
% Rank:
--
-647.01M
Peer Group Low
13.23B
Peer Group High
3 Months
% Rank:
--
-2.241B
Peer Group Low
3.962B
Peer Group High
3 Years
% Rank:
--
-12.70B
Peer Group Low
18.00B
Peer Group High
6 Months
% Rank:
--
-3.515B
Peer Group Low
5.649B
Peer Group High
5 Years
% Rank:
--
-1.461B
Peer Group Low
49.86B
Peer Group High
YTD
% Rank:
--
-2.086B
Peer Group Low
5.100B
Peer Group High
10 Years
% Rank:
--
-1.866B
Peer Group Low
81.23B
Peer Group High
Date Unavailable
Risk
Performance Versus Peer Group
Annual Total Returns Versus Peers
As of June 09, 2026.
Asset Allocation
As of April 30, 2026.
| Type | % Net |
|---|---|
| Cash | 4.92% |
| Stock | 7.89% |
| Bond | 79.39% |
| Convertible | 0.00% |
| Preferred | 0.00% |
| Other | 7.79% |
Top 10 Holdings
| Name | % Weight | Price | % Change |
|---|---|---|---|
|
Cardless Asset Receivable Trust FRN 15-Apr-2028
|
11.53% | -- | -- |
|
Mercury Financial Credit Card Master Trust FRN 20-Apr-2029
|
10.62% | -- | -- |
|
Cash and Cash Equivalents
|
10.35% | -- | -- |
|
TRESTLES HOLDINGS LLC
|
7.89% | -- | -- |
|
Arra Finance Automobile Trust I FRN 26-Jul-2027
|
5.45% | -- | -- |
|
Sothebys FRN 20-Dec-2029
|
4.81% | -- | -- |
|
Imprint Payments Inc FRN 31-Mar-2031
|
3.29% | -- | -- |
|
PMNBT 2025 FRN 15-Sep-2031
|
3.00% | -- | -- |
|
SOTHEBYS ARTFI MASTER TRUST 261 E FIX 7.27% 21-JUN-2033
|
2.79% | -- | -- |
|
ONDECK ASSET SECURITIZATION TRUST LLC 241 C FIX 8.99% 17-JUN-2031
|
2.46% | -- | -- |
Fees & Availability
| Fees | |
| Actual 12B-1 Fee | -- |
| Actual Management Fee | 0.25% |
| Administration Fee | 206.4K% |
| Maximum Front Load | -- |
| Maximum Deferred Load | -- |
| Maximum Redemption Fee | -- |
| General Availability | |
| Available for Insurance Product | No |
| Available for RRSP | No |
| Purchase Details | |
| Open to New Investors |
|
| Minimum Initial Investment | 1.00M None |
| Minimum Subsequent Investment | 10000.00 None |
Basic Info
| Investment Strategy | |
| The Fund seeks to provide attractive risk-adjusted returns and produce current income. It seeks to achieve its objective primarily by allocating its assets across a wide range of private credit strategies, with a focus on asset-backed credit strategies. It invest at least 80% of its net assets in private credit investment |
| General | |
| Security Type | Unlisted Closed-End Fund |
| Equity Style | -- |
| Broad Asset Class | Taxable Bond |
| Broad Category | Fixed Income |
| Global Peer Group | Bond USD |
| Peer Group | General Bond Funds |
| Global Macro | Bond HC |
| US Macro | General Domestic Taxable Fixed Income Funds |
| YCharts Categorization | -- |
| YCharts Benchmark | -- |
| Prospectus Objective | General Bond Funds |
| Fund Owner Firm Name | TCW Funds |
| Broad Asset Class Benchmark Index | |
| ^BBUSATR | 100.0% |
Fundamentals
| General | |
| Distribution Yield | -- |
| Dividend Yield TTM (6-8-26) | 7.31% |
| 30-Day SEC Yield (4-30-26) | 8.19% |
| 7-Day SEC Yield | -- |
| Number of Holdings | 46 |
| Stock | |
| Weighted Average PE Ratio | -- |
| Weighted Average Price to Sales Ratio | -- |
| Weighted Average Price to Book Ratio | -- |
| Weighted Median ROE | -- |
| Weighted Median ROA | -- |
| ROI (TTM) | -- |
| Return on Investment (TTM) | -- |
| Earning Yield | -- |
| LT Debt / Shareholders Equity | -- |
| Number of Equity Holdings | 1 |
| Bond | |
| Yield to Maturity (4-30-26) | 7.29% |
| Effective Duration | 0.91 |
| Average Coupon | 7.74% |
| Calculated Average Quality | 3.878 |
| Effective Maturity | 5.440 |
| Nominal Maturity | 5.440 |
| Number of Bond Holdings | 41 |
As of April 30, 2026
Growth Metrics
| EPS Growth (1Y) | -- |
| EPS Growth (3Y) | -- |
| EPS Growth (5Y) | -- |
| Sales Growth (1Y) | -- |
| Sales Growth (3Y) | -- |
| Sales Growth (5Y) | -- |
| Sales per Share Growth (1Y) | -- |
| Sales per Share Growth (3Y) | -- |
| Operating Cash Flow - Growth Rate (3Y) | -- |
As of April 30, 2026
Top Portfolio Holders
| Name | % Weight |
|---|---|
| Portfolio A | 5.00% |
| Portfolio B | 3.50% |
| Portfolio C | 2.25% |