

Morgan Stanley Institutional Gl Endurance Port C (MSJCX)
19.47
-0.06
(-0.31%)
USD |
May 29 2026
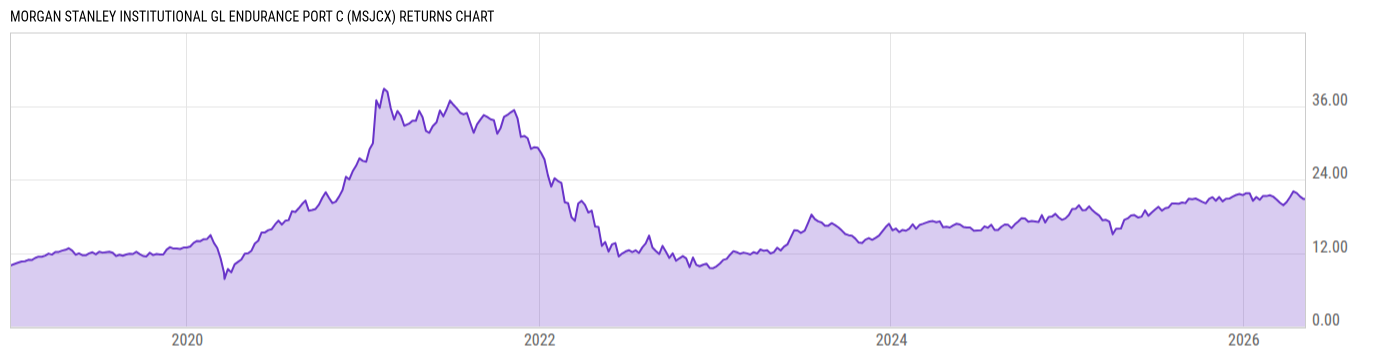
Returns Chart
Key Stats
| Net Expense Ratio | Total Assets Under Management | Weighted Average Dividend Yield | Turnover Ratio (Generic) |
|---|---|---|---|
| 2.10% | 15.35M | 0.18% | 176.0% |
| 1 Year Fund Level Flows | 1 Year Total Returns (Daily) | Annualized Total Returns Since Inception (Daily) | Max Drawdown (Since Inception) |
| -18.60M | 20.63% |
Basic Info
| Investment Strategy | |
| The Fund seeks long-term capital appreciation. The Fund invests primarily in equity securities of established and emerging companies located throughout the world, with rising returns on invested capital, above-average business visibility, strong free cash flow generation and an attractive risk/reward. |
| General | |
| Security Type | Mutual Fund |
| Equity Style | Mid Cap Growth |
| Broad Asset Class | International Equity |
| Broad Category | Equity |
| Global Peer Group | Equity Global Sm&Mid Cap |
| Peer Group | Global Small-/Mid-Cap Funds |
| Global Macro | Equity Global |
| US Macro | Developed Global Markets Funds |
| YCharts Categorization | -- |
| YCharts Benchmark | -- |
| Prospectus Objective | Global Small-Cap Funds |
| Fund Owner Firm Name | Morgan Stanley |
| Broad Asset Class Benchmark Index | |
| ^MSACXUSNTR | 100.0% |
Net Fund Flows Versus Peer Group
1 Month
% Rank:
22
-1.063B
Peer Group Low
11.32M
Peer Group High
1 Year
% Rank:
50
-18.60M
-2.926B
Peer Group Low
378.09M
Peer Group High
3 Months
% Rank:
27
-1.071B
Peer Group Low
21.79M
Peer Group High
3 Years
% Rank:
41
-2.898B
Peer Group Low
462.91M
Peer Group High
6 Months
% Rank:
49
-2.601B
Peer Group Low
154.18M
Peer Group High
5 Years
% Rank:
43
-12.29B
Peer Group Low
3.306B
Peer Group High
YTD
% Rank:
50
-1.798B
Peer Group Low
78.30M
Peer Group High
10 Years
% Rank:
25
-13.28B
Peer Group Low
14.28B
Peer Group High
Date Unavailable
Risk
Performance Versus Peer Group
Annual Total Returns Versus Peers
As of May 31, 2026.
Asset Allocation
As of December 31, 2025.
| Type | % Net |
|---|---|
| Cash | 0.29% |
| Stock | 89.05% |
| Bond | 10.53% |
| Convertible | 0.00% |
| Preferred | 0.00% |
| Other | 0.12% |
Top 10 Holdings
| Name | % Weight | Price | % Change |
|---|---|---|---|
| Roivant Sciences Ltd. | 8.75% | 29.99 | 0.37% |
| Victoria Plc | 7.90% | 0.5611 | 0.00% |
| QXO, Inc. | 5.37% | 17.25 | -2.43% |
| Teleflex, Inc. | 5.14% | 128.64 | -0.79% |
| Immunovant, Inc. | 4.67% | 33.30 | -0.60% |
| Calumet, Inc. | 4.67% | 35.47 | -0.08% |
| Arbutus Biopharma Corp. | 4.30% | 4.56 | -0.87% |
| Appian Corp. | 4.19% | 23.40 | 6.17% |
| Floor & Decor Holdings, Inc. | 3.77% | 51.40 | -0.04% |
| Royalty Pharma Plc | 3.19% | 55.76 | 2.35% |
Fees & Availability
| Fees | |
| Actual 12B-1 Fee | 1.00% |
| Actual Management Fee | -- |
| Administration Fee | 880.0% |
| Maximum Front Load | -- |
| Maximum Deferred Load | 1.00% |
| Maximum Redemption Fee | -- |
| General Availability | |
| Available for Insurance Product | No |
| Available for RRSP | No |
| Purchase Details | |
| Open to New Investors |
|
| Minimum Initial Investment | 1000.00 None |
| Minimum Subsequent Investment | 0.00 None |
Basic Info
| Investment Strategy | |
| The Fund seeks long-term capital appreciation. The Fund invests primarily in equity securities of established and emerging companies located throughout the world, with rising returns on invested capital, above-average business visibility, strong free cash flow generation and an attractive risk/reward. |
| General | |
| Security Type | Mutual Fund |
| Equity Style | Mid Cap Growth |
| Broad Asset Class | International Equity |
| Broad Category | Equity |
| Global Peer Group | Equity Global Sm&Mid Cap |
| Peer Group | Global Small-/Mid-Cap Funds |
| Global Macro | Equity Global |
| US Macro | Developed Global Markets Funds |
| YCharts Categorization | -- |
| YCharts Benchmark | -- |
| Prospectus Objective | Global Small-Cap Funds |
| Fund Owner Firm Name | Morgan Stanley |
| Broad Asset Class Benchmark Index | |
| ^MSACXUSNTR | 100.0% |
Fundamentals
| General | |
| Distribution Yield | -- |
| Dividend Yield TTM (5-28-26) | 0.84% |
| 30-Day SEC Yield | -- |
| 7-Day SEC Yield | -- |
| Number of Holdings | 38 |
| Stock | |
| Weighted Average PE Ratio | 32.92 |
| Weighted Average Price to Sales Ratio | 12.68 |
| Weighted Average Price to Book Ratio | 8.904 |
| Weighted Median ROE | 537.1% |
| Weighted Median ROA | -16.97% |
| ROI (TTM) | -23.86% |
| Return on Investment (TTM) | -23.86% |
| Earning Yield | 0.0379 |
| LT Debt / Shareholders Equity | 7.003 |
| Number of Equity Holdings | 34 |
| Bond | |
| Yield to Maturity (12-31-25) | -- |
| Effective Duration | -- |
| Average Coupon | -- |
| Calculated Average Quality | -- |
| Effective Maturity | -- |
| Nominal Maturity | -- |
| Number of Bond Holdings | 0 |
As of December 31, 2025
Growth Metrics
| EPS Growth (1Y) | -7.79% |
| EPS Growth (3Y) | -5.77% |
| EPS Growth (5Y) | 3.09% |
| Sales Growth (1Y) | -0.51% |
| Sales Growth (3Y) | 5.51% |
| Sales Growth (5Y) | 7.77% |
| Sales per Share Growth (1Y) | -7.54% |
| Sales per Share Growth (3Y) | -4.43% |
| Operating Cash Flow - Growth Rate (3Y) | 76.13% |
As of December 31, 2025
Top Portfolio Holders
| Name | % Weight |
|---|---|
| Portfolio A | 5.00% |
| Portfolio B | 3.50% |
| Portfolio C | 2.25% |
Excel Add-In Codes
| Name: =YCI("M:MSJCX", "name") |
| Broad Asset Class: =YCI("M:MSJCX", "broad_asset_class") |
| Broad Category: =YCI("M:MSJCX", "broad_category_group") |
| Prospectus Objective: =YCI("M:MSJCX", "prospectus_objective") |
| To find the codes for any of our securities and financial metrics, see our Complete Excel Reference. |