

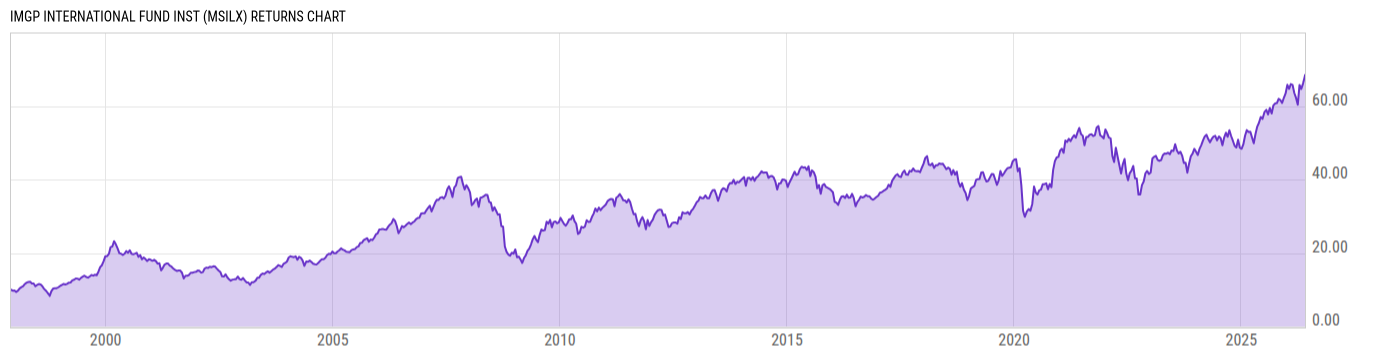
iMGP International Fund Inst (MSILX)
23.98
+0.01
(+0.04%)
USD |
May 28 2026
Returns Chart
Key Stats
| Net Expense Ratio | Total Assets Under Management | Weighted Average Dividend Yield | Turnover Ratio (Generic) |
|---|---|---|---|
| 1.24% | 127.23M | 2.09% | 99.00% |
| 1 Year Fund Level Flows | 1 Year Total Returns (Daily) | Annualized Total Returns Since Inception (Daily) | Max Drawdown (Since Inception) |
| -71.00M | 22.28% |
Basic Info
| Investment Strategy | |
| The Fund seeks long-term growth of capital. Under normal conditions the Fund will typically invest at least 80% of its assets in non-U.S. equities. The Fund's strategy is to engage a number of proven managers as sub-advisors. These sub-advisors will typically invest in eight to fifteen equity holdings each. |
| General | |
| Security Type | Mutual Fund |
| Equity Style | Multi Cap Growth |
| Broad Asset Class | International Equity |
| Broad Category | Equity |
| Global Peer Group | Equity Global ex US |
| Peer Group | International Multi-Cap Growth |
| Global Macro | Equity Global |
| US Macro | Developed International Markets Funds |
| YCharts Categorization | -- |
| YCharts Benchmark | -- |
| Prospectus Objective | International Funds |
| Fund Owner Firm Name | iM Global Partner |
| Broad Asset Class Benchmark Index | |
| ^MSACXUSNTR | 100.0% |
Net Fund Flows Versus Peer Group
1 Month
% Rank:
26
-736.26M
Peer Group Low
1.160B
Peer Group High
1 Year
% Rank:
42
-71.00M
-5.143B
Peer Group Low
8.703B
Peer Group High
3 Months
% Rank:
26
-2.000B
Peer Group Low
1.753B
Peer Group High
3 Years
% Rank:
40
-8.888B
Peer Group Low
26.37B
Peer Group High
6 Months
% Rank:
44
-3.722B
Peer Group Low
3.668B
Peer Group High
5 Years
% Rank:
43
-8.856B
Peer Group Low
31.65B
Peer Group High
YTD
% Rank:
31
-2.625B
Peer Group Low
1.737B
Peer Group High
10 Years
% Rank:
66
-26.31B
Peer Group Low
41.58B
Peer Group High
Date Unavailable
Risk
Performance Versus Peer Group
Annual Total Returns Versus Peers
As of May 29, 2026.
Asset Allocation
As of December 31, 2025.
| Type | % Net |
|---|---|
| Cash | 2.65% |
| Stock | 96.47% |
| Bond | 0.00% |
| Convertible | 0.00% |
| Preferred | 0.00% |
| Other | 0.88% |
Top 10 Holdings
| Name | % Weight | Price | % Change |
|---|---|---|---|
| ASML Holding NV | 6.09% | 1604.41 | 0.01% |
| Taiwan Semiconductor Manufacturing Co., Ltd. | 3.97% | 17.24 | 0.00% |
| Société Générale SA | 2.96% | 78.25 | 0.00% |
| SAP SE | 2.88% | 174.20 | 0.45% |
| Phoenix Financial Ltd. | 2.75% | 44.00 | 0.00% |
| Shopify, Inc. | 2.64% | 118.40 | 2.93% |
| MercadoLibre, Inc. | 2.53% | 1685.53 | -0.59% |
| The Sage Group plc | 2.41% | 11.70 | 0.21% |
|
Fixed Income Clearing Corp Repo
|
2.14% | -- | -- |
| Compass Group Plc | 2.13% | 30.68 | 0.00% |
Fees & Availability
| Fees | |
| Actual 12B-1 Fee | -- |
| Actual Management Fee | 0.89% |
| Administration Fee | 36.79K% |
| Maximum Front Load | -- |
| Maximum Deferred Load | -- |
| Maximum Redemption Fee | 0.00% |
| General Availability | |
| Available for Insurance Product | No |
| Available for RRSP | No |
| Purchase Details | |
| Open to New Investors |
|
| Minimum Initial Investment | 10000.00 None |
| Minimum Subsequent Investment | 250.00 None |
Basic Info
| Investment Strategy | |
| The Fund seeks long-term growth of capital. Under normal conditions the Fund will typically invest at least 80% of its assets in non-U.S. equities. The Fund's strategy is to engage a number of proven managers as sub-advisors. These sub-advisors will typically invest in eight to fifteen equity holdings each. |
| General | |
| Security Type | Mutual Fund |
| Equity Style | Multi Cap Growth |
| Broad Asset Class | International Equity |
| Broad Category | Equity |
| Global Peer Group | Equity Global ex US |
| Peer Group | International Multi-Cap Growth |
| Global Macro | Equity Global |
| US Macro | Developed International Markets Funds |
| YCharts Categorization | -- |
| YCharts Benchmark | -- |
| Prospectus Objective | International Funds |
| Fund Owner Firm Name | iM Global Partner |
| Broad Asset Class Benchmark Index | |
| ^MSACXUSNTR | 100.0% |
Fundamentals
| General | |
| Distribution Yield | -- |
| Dividend Yield TTM (5-27-26) | 1.44% |
| 30-Day SEC Yield | -- |
| 7-Day SEC Yield | -- |
| Number of Holdings | 72 |
| Stock | |
| Weighted Average PE Ratio | 26.78 |
| Weighted Average Price to Sales Ratio | 3.286 |
| Weighted Average Price to Book Ratio | 5.503 |
| Weighted Median ROE | 19.28% |
| Weighted Median ROA | 7.54% |
| ROI (TTM) | 13.08% |
| Return on Investment (TTM) | 13.08% |
| Earning Yield | 0.0488 |
| LT Debt / Shareholders Equity | 0.6409 |
| Number of Equity Holdings | 68 |
As of December 31, 2025
Growth Metrics
| EPS Growth (1Y) | 22.54% |
| EPS Growth (3Y) | 14.73% |
| EPS Growth (5Y) | 15.84% |
| Sales Growth (1Y) | 9.32% |
| Sales Growth (3Y) | 13.12% |
| Sales Growth (5Y) | 13.50% |
| Sales per Share Growth (1Y) | 9.65% |
| Sales per Share Growth (3Y) | 11.73% |
| Operating Cash Flow - Growth Rate (3Y) | 14.71% |
As of December 31, 2025
Fund Details
| Key Dates | |
| Inception Date | 12/1/1997 |
| Last Annual Report Date | 12/31/2025 |
| Last Prospectus Date | 4/29/2025 |
| Attributes | |
| Index Fund | -- |
| Inverse Fund | No |
| Leveraged Fund | -- |
| Fund of Funds | No |
| Currency Hedged Fund | -- |
| Socially Responsible Fund | No |
Top Portfolio Holders
| Name | % Weight |
|---|---|
| Portfolio A | 5.00% |
| Portfolio B | 3.50% |
| Portfolio C | 2.25% |
Excel Add-In Codes
| Name: =YCI("M:MSILX", "name") |
| Broad Asset Class: =YCI("M:MSILX", "broad_asset_class") |
| Broad Category: =YCI("M:MSILX", "broad_category_group") |
| Prospectus Objective: =YCI("M:MSILX", "prospectus_objective") |
| To find the codes for any of our securities and financial metrics, see our Complete Excel Reference. |