

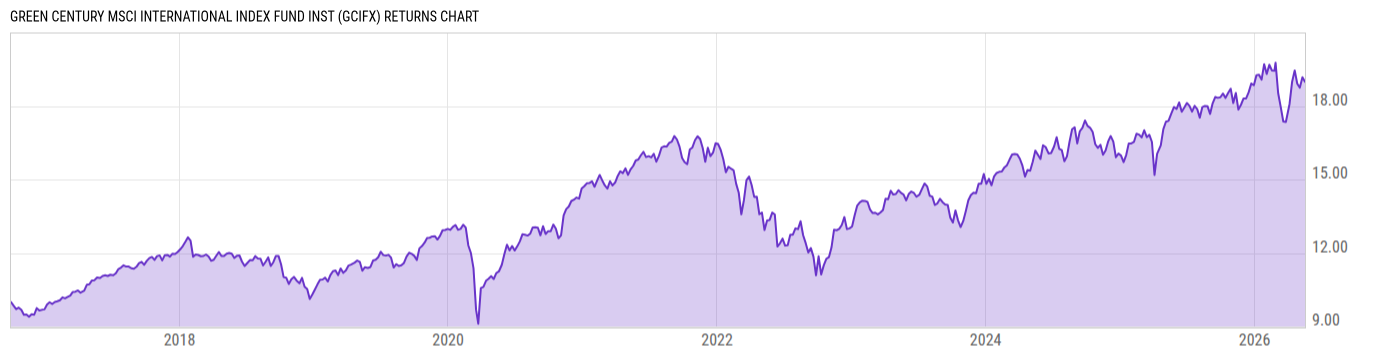
Green Century MSCI International Index Fund Inst (GCIFX)
15.81
+0.07
(+0.44%)
USD |
Jun 09 2026
Returns Chart
Key Stats
| Net Expense Ratio | Total Assets Under Management | Weighted Average Dividend Yield | Turnover Ratio (Generic) |
|---|---|---|---|
| 0.98% | 168.90M | 2.43% | 20.00% |
| 1 Year Fund Level Flows | 1 Year Total Returns (Daily) | Annualized Total Returns Since Inception (Daily) | Max Drawdown (Since Inception) |
| -14.25M | 6.07% |
Basic Info
| Investment Strategy | |
| The Fund seeks to invest all of its assets in the common stocks of the MSCI World ex USA SRI ex Fossil Fuels Index. The index includes large and mid-cap stocks from 22 developed markets countries (excluding US) and provides exposure to companies with outstanding Environmental, Social and Governance (ESG) ratings. |
| General | |
| Security Type | Mutual Fund |
| Equity Style | Large Cap Growth |
| Broad Asset Class | International Equity |
| Broad Category | Equity |
| Global Peer Group | Equity Global ex US |
| Peer Group | International Large-Cap Core |
| Global Macro | Equity Global |
| US Macro | Developed International Markets Funds |
| YCharts Categorization | -- |
| YCharts Benchmark | -- |
| Prospectus Objective | International Funds |
| Fund Owner Firm Name | Green Century Funds |
| Broad Asset Class Benchmark Index | |
| ^MSACXUSNTR | 100.0% |
Net Fund Flows Versus Peer Group
1 Month
% Rank:
42
-1.416B
Peer Group Low
611.47M
Peer Group High
1 Year
% Rank:
45
-14.25M
-4.826B
Peer Group Low
8.598B
Peer Group High
3 Months
% Rank:
50
-1.893B
Peer Group Low
2.883B
Peer Group High
3 Years
% Rank:
51
-8.607B
Peer Group Low
13.83B
Peer Group High
6 Months
% Rank:
47
-3.457B
Peer Group Low
5.772B
Peer Group High
5 Years
% Rank:
48
-11.24B
Peer Group Low
20.98B
Peer Group High
YTD
% Rank:
44
-2.548B
Peer Group Low
4.763B
Peer Group High
10 Years
% Rank:
40
-34.06B
Peer Group Low
37.07B
Peer Group High
Date Unavailable
Risk
Performance Versus Peer Group
Annual Total Returns Versus Peers
As of June 10, 2026.
Asset Allocation
As of March 31, 2026.
| Type | % Net |
|---|---|
| Cash | 0.18% |
| Stock | 98.44% |
| Bond | 0.00% |
| Convertible | 0.00% |
| Preferred | 0.38% |
| Other | 1.01% |
Top 10 Holdings
| Name | % Weight | Price | % Change |
|---|---|---|---|
| ASML Holding NV | 5.02% | 1683.72 | -3.25% |
| Schneider Electric SE | 2.98% | 300.00 | -3.38% |
| ABB Ltd. | 2.54% | 103.40 | 0.09% |
| Unilever Plc | 2.39% | 56.70 | 1.96% |
| Hitachi Ltd. | 2.36% | 30.05 | -9.06% |
| Novo Nordisk A/S | 2.35% | 41.70 | 1.09% |
| AIA Group Ltd. | 2.34% | 9.164 | -1.50% |
| Sony Group Corp. | 2.33% | 21.35 | -4.77% |
| Sumitomo Mitsui Financial Group, Inc. | 2.23% | 38.83 | 0.89% |
| Tokyo Electron Ltd. | 2.23% | 370.34 | 6.53% |
Fees & Availability
| Fees | |
| Actual 12B-1 Fee | -- |
| Actual Management Fee | 0.28% |
| Administration Fee | 882.4K% |
| Maximum Front Load | -- |
| Maximum Deferred Load | -- |
| Maximum Redemption Fee | 2.00% |
| General Availability | |
| Available for Insurance Product | No |
| Available for RRSP | No |
| Purchase Details | |
| Open to New Investors |
|
| Minimum Initial Investment | 250000.0 None |
| Minimum Subsequent Investment | 100.00 None |
Basic Info
| Investment Strategy | |
| The Fund seeks to invest all of its assets in the common stocks of the MSCI World ex USA SRI ex Fossil Fuels Index. The index includes large and mid-cap stocks from 22 developed markets countries (excluding US) and provides exposure to companies with outstanding Environmental, Social and Governance (ESG) ratings. |
| General | |
| Security Type | Mutual Fund |
| Equity Style | Large Cap Growth |
| Broad Asset Class | International Equity |
| Broad Category | Equity |
| Global Peer Group | Equity Global ex US |
| Peer Group | International Large-Cap Core |
| Global Macro | Equity Global |
| US Macro | Developed International Markets Funds |
| YCharts Categorization | -- |
| YCharts Benchmark | -- |
| Prospectus Objective | International Funds |
| Fund Owner Firm Name | Green Century Funds |
| Broad Asset Class Benchmark Index | |
| ^MSACXUSNTR | 100.0% |
Fundamentals
| General | |
| Distribution Yield | -- |
| Dividend Yield TTM (6-8-26) | 2.90% |
| 30-Day SEC Yield | -- |
| 7-Day SEC Yield | -- |
| Number of Holdings | 215 |
| Stock | |
| Weighted Average PE Ratio | 24.64 |
| Weighted Average Price to Sales Ratio | 4.220 |
| Weighted Average Price to Book Ratio | 5.104 |
| Weighted Median ROE | 20.80% |
| Weighted Median ROA | 7.68% |
| ROI (TTM) | 14.52% |
| Return on Investment (TTM) | 14.52% |
| Earning Yield | 0.0542 |
| LT Debt / Shareholders Equity | 0.5564 |
| Number of Equity Holdings | 188 |
As of March 31, 2026
Growth Metrics
| EPS Growth (1Y) | 18.65% |
| EPS Growth (3Y) | 14.11% |
| EPS Growth (5Y) | 18.42% |
| Sales Growth (1Y) | 8.58% |
| Sales Growth (3Y) | 8.33% |
| Sales Growth (5Y) | 9.27% |
| Sales per Share Growth (1Y) | 8.78% |
| Sales per Share Growth (3Y) | 8.81% |
| Operating Cash Flow - Growth Rate (3Y) | 15.12% |
As of March 31, 2026
Fund Details
| Key Dates | |
| Inception Date | 9/30/2016 |
| Last Annual Report Date | 7/31/2025 |
| Last Prospectus Date | 12/1/2025 |
| Share Classes | |
| GCINX | Inv |
| Attributes | |
| Index Fund |
|
| Inverse Fund | No |
| Leveraged Fund | -- |
| Fund of Funds | No |
| Currency Hedged Fund | -- |
| Socially Responsible Fund |
|
Top Portfolio Holders
| Name | % Weight |
|---|---|
| Portfolio A | 5.00% |
| Portfolio B | 3.50% |
| Portfolio C | 2.25% |
Excel Add-In Codes
| Name: =YCI("M:GCIFX", "name") |
| Broad Asset Class: =YCI("M:GCIFX", "broad_asset_class") |
| Broad Category: =YCI("M:GCIFX", "broad_category_group") |
| Prospectus Objective: =YCI("M:GCIFX", "prospectus_objective") |
| To find the codes for any of our securities and financial metrics, see our Complete Excel Reference. |