

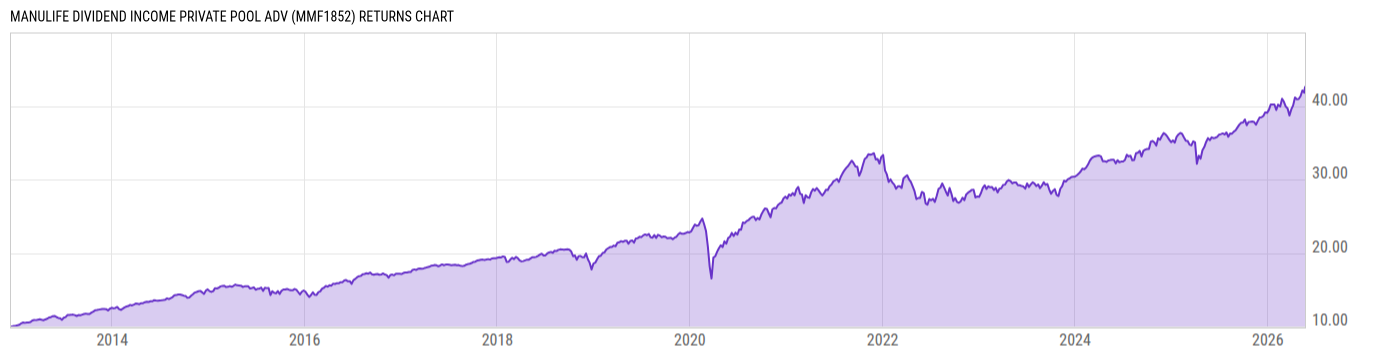
Manulife Dividend Income Private Pool Adv (MMF1852)
26.54
-0.08
(-0.30%)
CAD |
Jun 09 2026
Returns Chart
Key Stats
| Net Expense Ratio | Total Assets Under Management | Weighted Average Dividend Yield | Turnover Ratio (Generic) |
|---|---|---|---|
| 2.03% | 1.877B | 1.84% | 107.6% |
| 1 Year Fund Level Flows | 1 Year Total Returns (Daily) | Annualized Total Returns Since Inception (Daily) | Max Drawdown (Since Inception) |
| -151.36M | 19.49% |
Basic Info
| Investment Strategy | |
| The Pool seeks to provide investors with a combination of income and capital appreciation by investing primarily in a diversified portfolio of Canadian dividend paying common and preferred equity securities. |
| General | |
| Security Type | Mutual Fund |
| Equity Style | Large Cap Growth |
| Broad Asset Class | International Equity |
| Broad Category | Equity |
| Global Peer Group | Equity Canada |
| Peer Group | Canadian Focused Equity |
| Global Macro | Equity North America |
| US Macro | -- |
| YCharts Categorization | -- |
| YCharts Benchmark | -- |
| Prospectus Objective | -- |
| Fund Owner Firm Name | Manulife |
| Broad Asset Class Benchmark Index | |
| ^SPTSX60TR | 100.0% |
Net Fund Flows Versus Peer Group
1 Month
% Rank:
13
-288.92M
Peer Group Low
129.91M
Peer Group High
1 Year
% Rank:
91
-151.36M
-1.793B
Peer Group Low
1.903B
Peer Group High
3 Months
% Rank:
94
-486.95M
Peer Group Low
334.41M
Peer Group High
3 Years
% Rank:
90
-3.118B
Peer Group Low
4.022B
Peer Group High
6 Months
% Rank:
95
-1.297B
Peer Group Low
1.274B
Peer Group High
5 Years
% Rank:
69
-2.160B
Peer Group Low
5.304B
Peer Group High
YTD
% Rank:
93
-1.191B
Peer Group Low
693.56M
Peer Group High
10 Years
% Rank:
9
-4.521B
Peer Group Low
4.487B
Peer Group High
Date Unavailable
Risk
Performance Versus Peer Group
Annual Total Returns Versus Peers
As of June 10, 2026.
Asset Allocation
As of March 31, 2026.
| Type | % Net |
|---|---|
| Cash | 0.33% |
| Stock | 95.82% |
| Bond | 2.66% |
| Convertible | 0.00% |
| Preferred | 0.24% |
| Other | 0.95% |
Top 10 Holdings
| Name | % Weight | Price | % Change |
|---|---|---|---|
| Royal Bank of Canada | 5.83% | 197.89 | 1.32% |
| The Toronto-Dominion Bank | 4.82% | 114.64 | 0.41% |
| Canadian Natural Resources Ltd. | 3.71% | 44.81 | -3.20% |
| Canadian Imperial Bank of Commerce | 3.16% | 110.75 | 1.12% |
| Agnico Eagle Mines Ltd. | 3.11% | 159.93 | -1.34% |
| Suncor Energy, Inc. | 3.04% | 61.20 | -3.24% |
| National Bank of Canada | 2.81% | 207.27 | 1.40% |
| TC Energy Corp. | 2.67% | 68.17 | -0.12% |
| Shopify, Inc. | 2.66% | 110.42 | -0.32% |
| Power Corp of Canada | 2.52% | 84.74 | 2.11% |
Fees & Availability
| Fees | |
| Actual 12B-1 Fee | -- |
| Actual Management Fee | -- |
| Administration Fee | -- |
| Maximum Front Load | -- |
| Maximum Deferred Load | -- |
| Maximum Redemption Fee | -- |
| General Availability | |
| Available for Insurance Product | No |
| Available for RRSP |
|
| Purchase Details | |
| Open to New Investors |
|
| Minimum Initial Investment | 100000.0 None |
| Minimum Subsequent Investment | 25.00 None |
Basic Info
| Investment Strategy | |
| The Pool seeks to provide investors with a combination of income and capital appreciation by investing primarily in a diversified portfolio of Canadian dividend paying common and preferred equity securities. |
| General | |
| Security Type | Mutual Fund |
| Equity Style | Large Cap Growth |
| Broad Asset Class | International Equity |
| Broad Category | Equity |
| Global Peer Group | Equity Canada |
| Peer Group | Canadian Focused Equity |
| Global Macro | Equity North America |
| US Macro | -- |
| YCharts Categorization | -- |
| YCharts Benchmark | -- |
| Prospectus Objective | -- |
| Fund Owner Firm Name | Manulife |
| Broad Asset Class Benchmark Index | |
| ^SPTSX60TR | 100.0% |
Fundamentals
| General | |
| Distribution Yield | -- |
| Dividend Yield TTM (6-9-26) | 1.47% |
| 30-Day SEC Yield | -- |
| 7-Day SEC Yield | -- |
| Number of Holdings | 10 |
| Stock | |
| Weighted Average PE Ratio | 24.66 |
| Weighted Average Price to Sales Ratio | 5.623 |
| Weighted Average Price to Book Ratio | 5.310 |
| Weighted Median ROE | 38.93% |
| Weighted Median ROA | 8.97% |
| ROI (TTM) | 14.77% |
| Return on Investment (TTM) | 14.77% |
| Earning Yield | 0.0529 |
| LT Debt / Shareholders Equity | 0.5839 |
| Number of Equity Holdings | 10 |
As of March 31, 2026
Growth Metrics
| EPS Growth (1Y) | 36.03% |
| EPS Growth (3Y) | 18.14% |
| EPS Growth (5Y) | 17.06% |
| Sales Growth (1Y) | 14.85% |
| Sales Growth (3Y) | 10.16% |
| Sales Growth (5Y) | 12.77% |
| Sales per Share Growth (1Y) | 15.19% |
| Sales per Share Growth (3Y) | 10.37% |
| Operating Cash Flow - Growth Rate (3Y) | 20.09% |
As of March 31, 2026
Fund Details
| Key Dates | |
| Launch Date | 12/14/2012 |
| Last Annual Report Date | 10/31/2025 |
| Last Prospectus Date | -- |
| Share Classes | |
| MMF1087 | Fee-based Advice |
| MMF1832 | Commission-based Advice |
| MMF1953 | Commission-based Advice |
| MMF1954 | Commission-based Advice |
| MMF4018 | Fee-based Advice |
| Attributes | |
| Index Fund | -- |
| Inverse Fund | No |
| Leveraged Fund | -- |
| Fund of Funds | No |
| Currency Hedged Fund | -- |
| Socially Responsible Fund | No |
Top Portfolio Holders
| Name | % Weight |
|---|---|
| Portfolio A | 5.00% |
| Portfolio B | 3.50% |
| Portfolio C | 2.25% |
Excel Add-In Codes
| Name: =YCI("M:MMF1852", "name") |
| Broad Asset Class: =YCI("M:MMF1852", "broad_asset_class") |
| Broad Category: =YCI("M:MMF1852", "broad_category_group") |
| Prospectus Objective: =YCI("M:MMF1852", "prospectus_objective") |
| To find the codes for any of our securities and financial metrics, see our Complete Excel Reference. |