

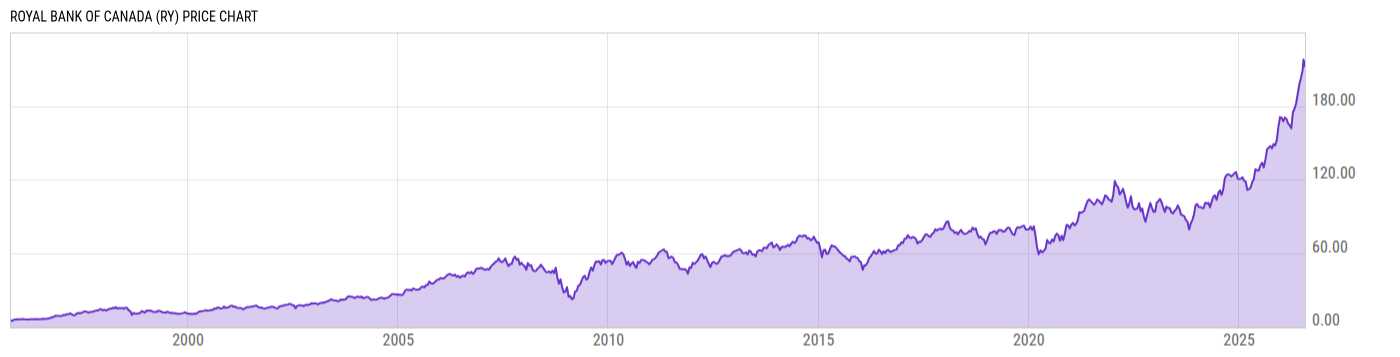
Royal Bank of Canada (RY)
212.34
+2.83
(+1.35%)
USD |
NYSE |
Jul 28, 16:00
212.34
0.00 (0.00%)
After-Hours: 20:00
Price Chart
Key Stats
| Price and Performance | |
|---|---|
| Market Cap | 294.97B |
| 52 Week High (Daily) | |
| 52 Week Low (Daily) | |
| All-Time High (Daily) | |
| Year to Date Total Returns (Daily) | |
| 1 Month Total Returns (Daily) | |
| 1 Year Total Returns (Daily) | 63.04% |
| Valuation | |
| PE Ratio | 19.05 |
| PE Ratio (Forward) | |
| PS Ratio | 2.990 |
| Price to Book Value | 3.099 |
| EV to EBITDA | |
| Dividend | |
|---|---|
| Dividend | 1.247 |
| Dividend Yield (Forward) | |
| Financials | |
| Revenue (5 Year Growth) | |
| Revenue (Quarterly YoY Growth) | |
| EPS Diluted (5 Year Growth) | |
| EPS Diluted (Quarterly YoY Growth) | |
| Debt to Equity Ratio | 2.774 |
| Return on Equity | |
| Return on Assets | |
| Risk | |
| Beta (5Y) | |
| Max Drawdown (5Y) | 28.67% |
Profile
| Royal Bank of Canada engages in the provision of banking and financial services. It operates through the following segments: Personal and Commercial Banking, Wealth Management, Insurance, Capital Markets, and Corporate Support. The Personal and Commercial Banking segment deals with a broad suite of financial products and services in both individual and business clients in Canada, the Caribbean, and the U.S. The Wealth Management segment offers a suite of wealth, investment, trust, banking, credit, and other advice-based solutions. It also offers other wealth management solutions to institutional and individual clients through its distribution channels and third-party distributors. The Insurance segment refers to a suite of advice and solutions for individual and business clients including life, health, wealth, property and casualty, travel, group benefits, annuities, and reinsurance. The Capital Markets segment is involved in the provision of advisory and origination, sales and trading, lending and financing and transaction banking to corporations, institutional clients, asset managers, private equity firms and governments globally. The Corporate Support segment consists of technology and operations services. The company was founded by J. W. Merkell, Edward Kenny, T. C. Kinnear, James B. Duffus, William Cunard, John Tobin, George P. Mitchell and Jeremiah Northup in 1864 and is headquartered in Toronto, Canada. |
| URL | http://www.rbc.com |
| Investor Relations URL | https://www.rbc.com/investor-relations/ |
| HQ State/Province | Ontario |
| Sector | Financials |
| Industry | Banks |
| Equity Style | Large Cap Core |
| Next Earnings Release | Aug. 27, 2026 |
| Last Earnings Release | May. 28, 2026 |
| Next Ex-Dividend Date | N/A |
| Last Ex-Dividend Date | Jul. 27, 2026 |