

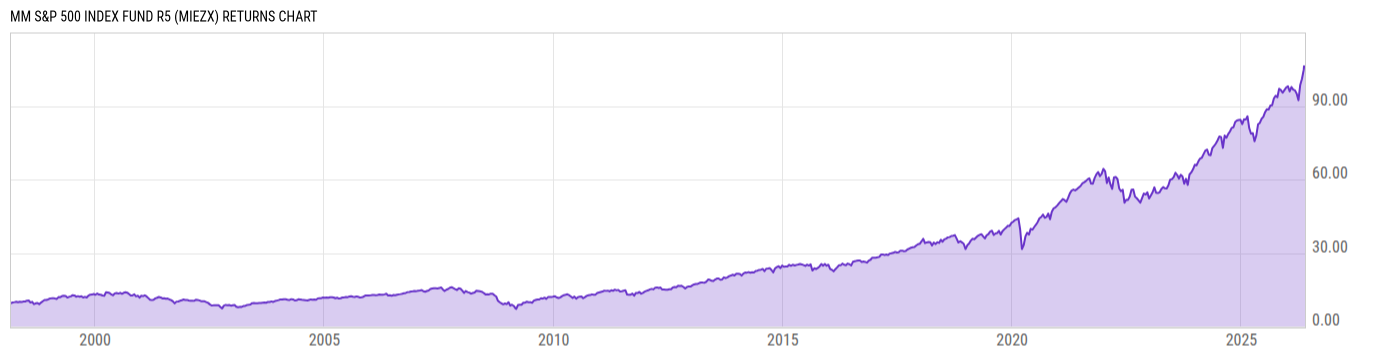
MM S&P 500 Index Fund R5 (MIEZX)
16.13
+0.06
(+0.37%)
USD |
May 22 2026
Returns Chart
Key Stats
| Net Expense Ratio | Total Assets Under Management | Weighted Average Dividend Yield | Turnover Ratio (Generic) |
|---|---|---|---|
| 0.24% | 2.262B | 1.19% | 5.00% |
| 1 Year Fund Level Flows | 1 Year Total Returns (Daily) | Annualized Total Returns Since Inception (Daily) | Max Drawdown (Since Inception) |
| -467.43M | 29.18% |
Basic Info
| Investment Strategy | |
| The Fund seeks to provide investment results that correspond to the total return performance of publicly traded common stocks as represented by the S&P 500 Index. Under normal circumstances, the Fund invests at least 80% of its net assets in the equity securities of companies included within the S&P 500 Index. |
| General | |
| Security Type | Mutual Fund |
| Equity Style | Large Cap Core |
| Broad Asset Class | US Equity |
| Broad Category | Equity |
| Global Peer Group | Equity US |
| Peer Group | S&P 500 Index Funds |
| Global Macro | Equity North America |
| US Macro | Large-Cap Funds |
| YCharts Categorization | -- |
| YCharts Benchmark | -- |
| Prospectus Objective | S&P 500 Index Objective Funds |
| Fund Owner Firm Name | MassMutual |
| Broad Asset Class Benchmark Index | |
| ^SPXTR | 100.0% |
Net Fund Flows Versus Peer Group
1 Month
% Rank:
68
-6.459B
Peer Group Low
22.33B
Peer Group High
1 Year
% Rank:
69
-467.43M
-118.42B
Peer Group Low
56.24B
Peer Group High
3 Months
% Rank:
80
-10.26B
Peer Group Low
26.38B
Peer Group High
3 Years
% Rank:
80
-69.98B
Peer Group Low
178.71B
Peer Group High
6 Months
% Rank:
72
-16.10B
Peer Group Low
56.64B
Peer Group High
5 Years
% Rank:
83
-119.05B
Peer Group Low
205.00B
Peer Group High
YTD
% Rank:
79
-16.47B
Peer Group Low
34.46B
Peer Group High
10 Years
% Rank:
90
-224.27B
Peer Group Low
309.27B
Peer Group High
Date Unavailable
Risk
Performance Versus Peer Group
Annual Total Returns Versus Peers
As of May 24, 2026.
Asset Allocation
As of March 31, 2026.
| Type | % Net |
|---|---|
| Cash | 0.13% |
| Stock | 99.90% |
| Bond | 0.00% |
| Convertible | 0.00% |
| Preferred | 0.00% |
| Other | -0.03% |
Top 10 Holdings
| Name | % Weight | Price | % Change |
|---|---|---|---|
| NVIDIA Corp. | 7.84% | 215.33 | -1.90% |
| Apple, Inc. | 6.44% | 308.82 | 1.26% |
| Microsoft Corp. | 4.89% | 418.57 | -0.12% |
| Amazon.com, Inc. | 4.18% | 266.32 | -0.80% |
| Alphabet, Inc. | 3.62% | 382.97 | -1.21% |
| Broadcom Inc. | 3.20% | 414.14 | -0.10% |
| Alphabet, Inc. | 2.89% | 379.38 | -1.07% |
| Meta Platforms, Inc. | 2.16% | 610.26 | 0.47% |
| Tesla, Inc. | 1.73% | 426.01 | 1.95% |
| Berkshire Hathaway, Inc. | 1.40% | 486.38 | 1.33% |
Fees & Availability
| Fees | |
| Actual 12B-1 Fee | -- |
| Actual Management Fee | 0.10% |
| Administration Fee | 397.8K% |
| Maximum Front Load | -- |
| Maximum Deferred Load | -- |
| Maximum Redemption Fee | -- |
| General Availability | |
| Available for Insurance Product | No |
| Available for RRSP | No |
| Purchase Details | |
| Open to New Investors |
|
| Minimum Initial Investment | 0.00 None |
| Minimum Subsequent Investment | 0.00 None |
Basic Info
| Investment Strategy | |
| The Fund seeks to provide investment results that correspond to the total return performance of publicly traded common stocks as represented by the S&P 500 Index. Under normal circumstances, the Fund invests at least 80% of its net assets in the equity securities of companies included within the S&P 500 Index. |
| General | |
| Security Type | Mutual Fund |
| Equity Style | Large Cap Core |
| Broad Asset Class | US Equity |
| Broad Category | Equity |
| Global Peer Group | Equity US |
| Peer Group | S&P 500 Index Funds |
| Global Macro | Equity North America |
| US Macro | Large-Cap Funds |
| YCharts Categorization | -- |
| YCharts Benchmark | -- |
| Prospectus Objective | S&P 500 Index Objective Funds |
| Fund Owner Firm Name | MassMutual |
| Broad Asset Class Benchmark Index | |
| ^SPXTR | 100.0% |
Fundamentals
| General | |
| Distribution Yield | -- |
| Dividend Yield TTM (5-21-26) | 1.02% |
| 30-Day SEC Yield | -- |
| 7-Day SEC Yield | -- |
| Number of Holdings | 10 |
| Stock | |
| Weighted Average PE Ratio | 30.94 |
| Weighted Average Price to Sales Ratio | 7.664 |
| Weighted Average Price to Book Ratio | 10.88 |
| Weighted Median ROE | 111.4% |
| Weighted Median ROA | 17.58% |
| ROI (TTM) | 24.74% |
| Return on Investment (TTM) | 24.74% |
| Earning Yield | 0.0391 |
| LT Debt / Shareholders Equity | 0.7243 |
| Number of Equity Holdings | 10 |
As of March 31, 2026
Growth Metrics
| EPS Growth (1Y) | 23.57% |
| EPS Growth (3Y) | 20.17% |
| EPS Growth (5Y) | 25.63% |
| Sales Growth (1Y) | 15.04% |
| Sales Growth (3Y) | 15.37% |
| Sales Growth (5Y) | 16.14% |
| Sales per Share Growth (1Y) | 15.99% |
| Sales per Share Growth (3Y) | 16.09% |
| Operating Cash Flow - Growth Rate (3Y) | 26.32% |
As of March 31, 2026
Fund Details
| Key Dates | |
| Inception Date | 5/1/2001 |
| Last Annual Report Date | 9/30/2025 |
| Last Prospectus Date | 2/1/2026 |
| Share Classes | |
| MIEAX | Retirement |
| MIEYX | Administrator |
| MMFFX | A |
| MMIEX | Service |
| MMINX | Retirement |
| MMIZX | Inst |
| Attributes | |
| Index Fund |
|
| Inverse Fund | No |
| Leveraged Fund | -- |
| Fund of Funds | No |
| Currency Hedged Fund | -- |
| Socially Responsible Fund | No |
Top Portfolio Holders
| Name | % Weight |
|---|---|
| Portfolio A | 5.00% |
| Portfolio B | 3.50% |
| Portfolio C | 2.25% |
Excel Add-In Codes
| Name: =YCI("M:MIEZX", "name") |
| Broad Asset Class: =YCI("M:MIEZX", "broad_asset_class") |
| Broad Category: =YCI("M:MIEZX", "broad_category_group") |
| Prospectus Objective: =YCI("M:MIEZX", "prospectus_objective") |
| To find the codes for any of our securities and financial metrics, see our Complete Excel Reference. |