

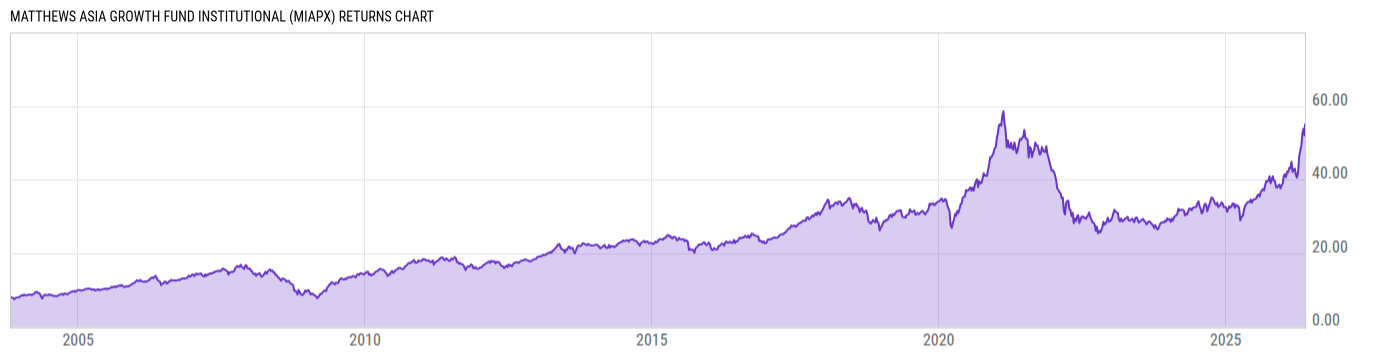
Matthews Asia Growth Fund Institutional (MIAPX)
38.75
-1.32
(-3.29%)
USD |
Jun 10 2026
Returns Chart
Key Stats
| Net Expense Ratio | Total Assets Under Management | Weighted Average Dividend Yield | Turnover Ratio (Generic) |
|---|---|---|---|
| 1.19% | 309.59M | 0.85% | 95.00% |
| 1 Year Fund Level Flows | 1 Year Total Returns (Daily) | Annualized Total Returns Since Inception (Daily) | Max Drawdown (Since Inception) |
| -39.53M | 58.94% |
Basic Info
| Investment Strategy | |
| The Fund seeks Long-term capital appreciation. Under normal market conditions, the Matthews Asia Growth Fund seeks to achieve its investment objective by investing at least 80% of its net assets, which include borrowings for investment purposes, in the common and preferred stocks of companies located in Asia. |
| General | |
| Security Type | Mutual Fund |
| Equity Style | Large Cap Growth |
| Broad Asset Class | International Equity |
| Broad Category | Equity |
| Global Peer Group | Equity Asia Pacific |
| Peer Group | Pacific Region Funds |
| Global Macro | Equity Asia Pacific |
| US Macro | Developed International Markets Funds |
| YCharts Categorization | -- |
| YCharts Benchmark | -- |
| Prospectus Objective | Pacific Region Funds |
| Fund Owner Firm Name | Matthews Asia |
| Broad Asset Class Benchmark Index | |
| ^MSACXUSNTR | 100.0% |
Net Fund Flows Versus Peer Group
1 Month
% Rank:
27
-343.89M
Peer Group Low
108.30M
Peer Group High
1 Year
% Rank:
56
-39.53M
-1.897B
Peer Group Low
79.13M
Peer Group High
3 Months
% Rank:
56
-869.80M
Peer Group Low
57.03M
Peer Group High
3 Years
% Rank:
68
-1.653B
Peer Group Low
43.30M
Peer Group High
6 Months
% Rank:
62
-1.873B
Peer Group Low
294.18M
Peer Group High
5 Years
% Rank:
98
-1.281B
Peer Group Low
462.54M
Peer Group High
YTD
% Rank:
74
-1.915B
Peer Group Low
111.03M
Peer Group High
10 Years
% Rank:
92
-1.376B
Peer Group Low
550.40M
Peer Group High
Date Unavailable
Risk
Performance Versus Peer Group
Annual Total Returns Versus Peers
As of June 11, 2026.
Asset Allocation
As of March 31, 2026.
| Type | % Net |
|---|---|
| Cash | 0.00% |
| Stock | 90.08% |
| Bond | 0.00% |
| Convertible | 0.00% |
| Preferred | 0.00% |
| Other | 9.92% |
Top 10 Holdings
| Name | % Weight | Price | % Change |
|---|---|---|---|
|
Other Assets less Liabilities
|
9.92% | -- | -- |
| Samsung Electronics Co., Ltd. | 7.57% | 140.00 | 0.00% |
| Taiwan Semiconductor Manufacturing Co., Ltd. | 7.36% | 17.24 | 0.00% |
|
Samsung Electro-Mechanics Co Ltd ORD
|
4.00% | -- | -- |
|
Delta Electronics Inc ORD
|
3.69% | -- | -- |
| Tencent Holdings Ltd. | 3.51% | 59.71 | 3.91% |
|
SK Hynix Inc ORD
|
3.48% | -- | -- |
| Alibaba Group Holding Ltd. | 3.28% | 15.32 | 0.66% |
|
Contemporary Amperex Technology Co Ltd ORD
|
3.22% | -- | -- |
|
Hanwha AeroSpace Co Ltd ORD
|
2.88% | -- | -- |
Fees & Availability
| Fees | |
| Actual 12B-1 Fee | -- |
| Actual Management Fee | 0.71% |
| Administration Fee | 213.6K% |
| Maximum Front Load | -- |
| Maximum Deferred Load | -- |
| Maximum Redemption Fee | 0.00% |
| General Availability | |
| Available for Insurance Product | No |
| Available for RRSP | No |
| Purchase Details | |
| Open to New Investors |
|
| Minimum Initial Investment | 100000.0 None |
| Minimum Subsequent Investment | 100.00 None |
Basic Info
| Investment Strategy | |
| The Fund seeks Long-term capital appreciation. Under normal market conditions, the Matthews Asia Growth Fund seeks to achieve its investment objective by investing at least 80% of its net assets, which include borrowings for investment purposes, in the common and preferred stocks of companies located in Asia. |
| General | |
| Security Type | Mutual Fund |
| Equity Style | Large Cap Growth |
| Broad Asset Class | International Equity |
| Broad Category | Equity |
| Global Peer Group | Equity Asia Pacific |
| Peer Group | Pacific Region Funds |
| Global Macro | Equity Asia Pacific |
| US Macro | Developed International Markets Funds |
| YCharts Categorization | -- |
| YCharts Benchmark | -- |
| Prospectus Objective | Pacific Region Funds |
| Fund Owner Firm Name | Matthews Asia |
| Broad Asset Class Benchmark Index | |
| ^MSACXUSNTR | 100.0% |
Fundamentals
| General | |
| Distribution Yield | -- |
| Dividend Yield TTM (6-10-26) | 0.00% |
| 30-Day SEC Yield | -- |
| 7-Day SEC Yield | -- |
| Number of Holdings | 57 |
| Stock | |
| Weighted Average PE Ratio | 34.33 |
| Weighted Average Price to Sales Ratio | 7.090 |
| Weighted Average Price to Book Ratio | 6.478 |
| Weighted Median ROE | 20.22% |
| Weighted Median ROA | 11.51% |
| ROI (TTM) | 16.41% |
| Return on Investment (TTM) | 16.41% |
| Earning Yield | 0.0357 |
| LT Debt / Shareholders Equity | 0.1796 |
| Number of Equity Holdings | 53 |
As of March 31, 2026
Growth Metrics
| EPS Growth (1Y) | 36.33% |
| EPS Growth (3Y) | 24.57% |
| EPS Growth (5Y) | 25.55% |
| Sales Growth (1Y) | 23.87% |
| Sales Growth (3Y) | 15.57% |
| Sales Growth (5Y) | 18.38% |
| Sales per Share Growth (1Y) | 26.35% |
| Sales per Share Growth (3Y) | 15.41% |
| Operating Cash Flow - Growth Rate (3Y) | 25.87% |
As of March 31, 2026
Fund Details
| Key Dates | |
| Inception Date | 10/29/2010 |
| Last Annual Report Date | 12/31/2025 |
| Last Prospectus Date | 4/30/2025 |
| Share Classes | |
| MPACX | Inv |
| Attributes | |
| Index Fund | -- |
| Inverse Fund | No |
| Leveraged Fund | -- |
| Fund of Funds | No |
| Currency Hedged Fund | -- |
| Socially Responsible Fund | No |
Top Portfolio Holders
| Name | % Weight |
|---|---|
| Portfolio A | 5.00% |
| Portfolio B | 3.50% |
| Portfolio C | 2.25% |
Excel Add-In Codes
| Name: =YCI("M:MIAPX", "name") |
| Broad Asset Class: =YCI("M:MIAPX", "broad_asset_class") |
| Broad Category: =YCI("M:MIAPX", "broad_category_group") |
| Prospectus Objective: =YCI("M:MIAPX", "prospectus_objective") |
| To find the codes for any of our securities and financial metrics, see our Complete Excel Reference. |