

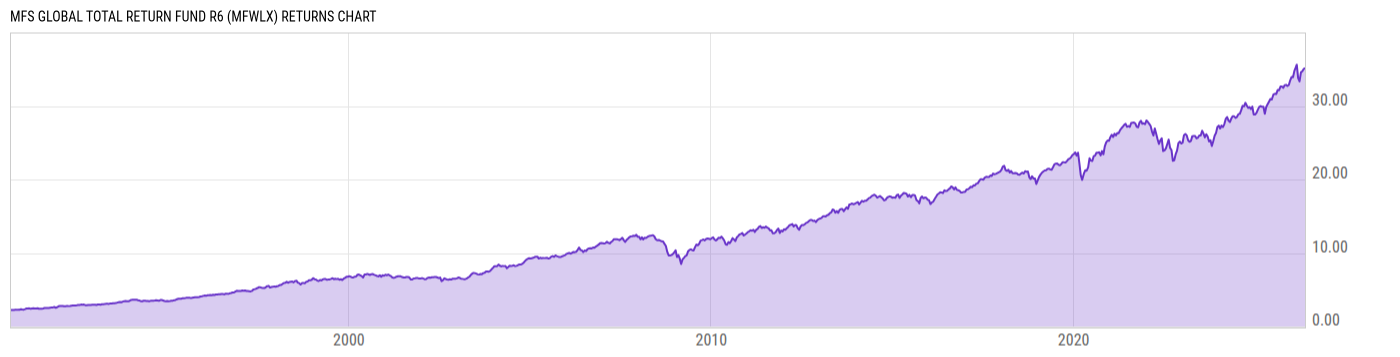
MFS Global Total Return Fund R6 (MFWLX)
17.86
+0.07
(+0.39%)
USD |
Jun 09 2026
Returns Chart
Key Stats
| Net Expense Ratio | Total Assets Under Management | Weighted Average Dividend Yield | Turnover Ratio (Generic) |
|---|---|---|---|
| 0.77% | 1.225B | 2.82% | 62.00% |
| 1 Year Fund Level Flows | 1 Year Total Returns (Daily) | Annualized Total Returns Since Inception (Daily) | Max Drawdown (Since Inception) |
| -158.06M | 13.62% |
Basic Info
| Investment Strategy | |
| The Fund seeks total return by investing in domestic and foreign equity and fixed-income securities. The Fund is non-diversified and will normally invest in at least three countries, including the U.S. |
| General | |
| Security Type | Mutual Fund |
| Equity Style | Large Cap Value |
| Broad Asset Class | Allocation |
| Broad Category | Allocation |
| Global Peer Group | Mixed Asset USD Balanced - Global |
| Peer Group | Mixed-Asset Target Alloc Moderate Funds |
| Global Macro | Mixed Asset HC Balanced |
| US Macro | Mixed-Assets Target Allocation Funds |
| YCharts Categorization | -- |
| YCharts Benchmark | -- |
| Prospectus Objective | Balanced Funds |
| Fund Owner Firm Name | MFS |
| Broad Asset Class Benchmark Index | |
| ^SPXTR | 100.0% |
Net Fund Flows Versus Peer Group
1 Month
% Rank:
73
-365.62M
Peer Group Low
32.29M
Peer Group High
1 Year
% Rank:
69
-158.06M
-5.510B
Peer Group Low
642.22M
Peer Group High
3 Months
% Rank:
74
-1.193B
Peer Group Low
97.62M
Peer Group High
3 Years
% Rank:
72
-21.36B
Peer Group Low
3.106B
Peer Group High
6 Months
% Rank:
76
-3.729B
Peer Group Low
576.03M
Peer Group High
5 Years
% Rank:
76
-30.46B
Peer Group Low
2.725B
Peer Group High
YTD
% Rank:
71
-1.851B
Peer Group Low
585.46M
Peer Group High
10 Years
% Rank:
70
-51.73B
Peer Group Low
3.718B
Peer Group High
Date Unavailable
Risk
Performance Versus Peer Group
Annual Total Returns Versus Peers
As of June 10, 2026.
Asset Allocation
As of April 30, 2026.
| Type | % Net |
|---|---|
| Cash | 1.52% |
| Stock | 59.15% |
| Bond | 37.42% |
| Convertible | 0.00% |
| Preferred | 1.10% |
| Other | 0.81% |
Top 10 Holdings
| Name | % Weight | Price | % Change |
|---|---|---|---|
|
JPY/USD Forward Contract
|
2.14% | -- | -- |
|
CNH/USD Forward Contract
|
1.50% | -- | -- |
| The Cigna Group | 1.38% | 295.00 | 1.86% |
|
USD Cash
|
1.37% | -- | -- |
| Northern Trust Corp. | 1.30% | 170.60 | 0.88% |
| Pfizer Inc. | 1.29% | 25.70 | 0.31% |
|
USD/GBP Forward Contract
|
1.24% | -- | -- |
| The Charles Schwab Corp. | 1.20% | 88.77 | 0.78% |
| United States of America USGB 4.0 03/31/2030 FIX USD Government | 1.19% | 99.22 | 0.12% |
| Eni SpA | 1.14% | 26.05 | 0.00% |
Fees & Availability
| Fees | |
| Actual 12B-1 Fee | -- |
| Actual Management Fee | 0.69% |
| Administration Fee | 30.08K% |
| Maximum Front Load | -- |
| Maximum Deferred Load | -- |
| Maximum Redemption Fee | -- |
| General Availability | |
| Available for Insurance Product | No |
| Available for RRSP | No |
| Purchase Details | |
| Open to New Investors |
|
| Minimum Initial Investment | 0.00 None |
| Minimum Subsequent Investment | 0.00 None |
Basic Info
| Investment Strategy | |
| The Fund seeks total return by investing in domestic and foreign equity and fixed-income securities. The Fund is non-diversified and will normally invest in at least three countries, including the U.S. |
| General | |
| Security Type | Mutual Fund |
| Equity Style | Large Cap Value |
| Broad Asset Class | Allocation |
| Broad Category | Allocation |
| Global Peer Group | Mixed Asset USD Balanced - Global |
| Peer Group | Mixed-Asset Target Alloc Moderate Funds |
| Global Macro | Mixed Asset HC Balanced |
| US Macro | Mixed-Assets Target Allocation Funds |
| YCharts Categorization | -- |
| YCharts Benchmark | -- |
| Prospectus Objective | Balanced Funds |
| Fund Owner Firm Name | MFS |
| Broad Asset Class Benchmark Index | |
| ^SPXTR | 100.0% |
Fundamentals
| General | |
| Distribution Yield | -- |
| Dividend Yield TTM (6-8-26) | 3.40% |
| 30-Day SEC Yield (4-30-26) | 2.68% |
| 7-Day SEC Yield | -- |
| Number of Holdings | 885 |
| Stock | |
| Weighted Average PE Ratio | 21.51 |
| Weighted Average Price to Sales Ratio | 2.853 |
| Weighted Average Price to Book Ratio | 3.713 |
| Weighted Median ROE | 139.4% |
| Weighted Median ROA | 6.05% |
| ROI (TTM) | 10.82% |
| Return on Investment (TTM) | 10.82% |
| Earning Yield | 0.0593 |
| LT Debt / Shareholders Equity | 1.314 |
| Number of Equity Holdings | 185 |
| Bond | |
| Yield to Maturity (4-30-26) | 4.35% |
| Effective Duration | 5.40 |
| Average Coupon | 3.83% |
| Calculated Average Quality | 2.689 |
| Effective Maturity | 11.84 |
| Nominal Maturity | 11.94 |
| Number of Bond Holdings | 603 |
As of April 30, 2026
Growth Metrics
| EPS Growth (1Y) | 17.26% |
| EPS Growth (3Y) | 6.28% |
| EPS Growth (5Y) | 14.27% |
| Sales Growth (1Y) | 3.55% |
| Sales Growth (3Y) | 3.60% |
| Sales Growth (5Y) | 8.01% |
| Sales per Share Growth (1Y) | 4.79% |
| Sales per Share Growth (3Y) | 5.04% |
| Operating Cash Flow - Growth Rate (3Y) | 11.05% |
As of April 30, 2026
Fund Details
| Key Dates | |
| Inception Date | 6/1/2012 |
| Last Annual Report Date | 10/31/2025 |
| Last Prospectus Date | 2/27/2026 |
| Share Classes | |
| MFWBX | B |
| MFWCX | C |
| MFWGX | Retirement |
| MFWHX | Retirement |
| MFWIX | Inst |
| MFWJX | Retirement |
| MFWTX | A |
| MGBRX | Retirement |
| Attributes | |
| Index Fund | -- |
| Inverse Fund | No |
| Leveraged Fund | -- |
| Fund of Funds | No |
| Currency Hedged Fund | -- |
| Socially Responsible Fund | No |
Top Portfolio Holders
| Name | % Weight |
|---|---|
| Portfolio A | 5.00% |
| Portfolio B | 3.50% |
| Portfolio C | 2.25% |
Excel Add-In Codes
| Name: =YCI("M:MFWLX", "name") |
| Broad Asset Class: =YCI("M:MFWLX", "broad_asset_class") |
| Broad Category: =YCI("M:MFWLX", "broad_category_group") |
| Prospectus Objective: =YCI("M:MFWLX", "prospectus_objective") |
| To find the codes for any of our securities and financial metrics, see our Complete Excel Reference. |