

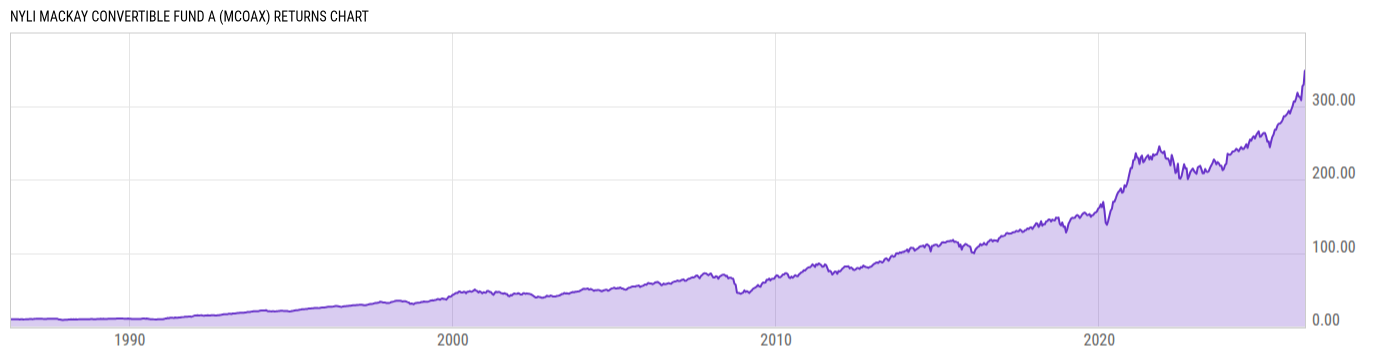
NYLI MacKay Convertible Fund A (MCOAX)
23.14
+0.16
(+0.70%)
USD |
May 13 2026
Returns Chart
Key Stats
| Net Expense Ratio | Total Assets Under Management | Weighted Average Dividend Yield | Turnover Ratio (Generic) |
|---|---|---|---|
| 0.93% | 1.852B | -- | 40.00% |
| 1 Year Fund Level Flows | 1 Year Total Returns (Daily) | Annualized Total Returns Since Inception (Daily) | Max Drawdown (Since Inception) |
| -121.75M | 31.25% |
Basic Info
| Investment Strategy | |
| The Fund seeks capital appreciation together with current income. The Fund invests at least 80% of its assets in convertible securities like bonds, debentures, corporate notes, preferred stocks or other securities that are convertible to common stock or the cash value of a stock or a basket or index of equity securities. |
| General | |
| Security Type | Mutual Fund |
| Equity Style | -- |
| Broad Asset Class | Allocation |
| Broad Category | Fixed Income |
| Global Peer Group | Bond Convertibles US |
| Peer Group | Convertible Securities Funds |
| Global Macro | Bond Other |
| US Macro | Mixed-Assets Funds |
| YCharts Categorization | -- |
| YCharts Benchmark | -- |
| Prospectus Objective | Convertible Securities Funds |
| Fund Owner Firm Name | New York Life Investments |
| Broad Asset Class Benchmark Index | |
| ^SPXTR | 100.0% |
Net Fund Flows Versus Peer Group
1 Month
% Rank:
45
-85.57M
Peer Group Low
761.20M
Peer Group High
1 Year
% Rank:
89
-121.75M
-275.56M
Peer Group Low
2.558B
Peer Group High
3 Months
% Rank:
23
-125.80M
Peer Group Low
583.89M
Peer Group High
3 Years
% Rank:
78
-954.27M
Peer Group Low
3.432B
Peer Group High
6 Months
% Rank:
56
-221.08M
Peer Group Low
2.066B
Peer Group High
5 Years
% Rank:
58
-2.647B
Peer Group Low
3.059B
Peer Group High
YTD
% Rank:
25
-145.83M
Peer Group Low
1.400B
Peer Group High
10 Years
% Rank:
35
-2.618B
Peer Group Low
4.433B
Peer Group High
Date Unavailable
Risk
Performance Versus Peer Group
Annual Total Returns Versus Peers
As of May 14, 2026.
Asset Allocation
As of November 30, 2025.
| Type | % Net |
|---|---|
| Cash | 0.00% |
| Stock | 0.00% |
| Bond | 72.63% |
| Convertible | 12.24% |
| Preferred | 8.51% |
| Other | 6.62% |
Top 10 Holdings
| Name | % Weight | Price | % Change |
|---|---|---|---|
| NYLI U.S. Government Liquidity Class I | 5.74% | 1.00 | 0.00% |
| Welltower OP LLC WELLTOO 3.125 07/15/2029 FIX USD Corporate 144A | 2.94% | 171.56 | 0.84% |
| Seagate HDD Cayman SEAGHDD 3.5 06/01/2028 FIX USD Corporate 144A | 2.87% | 988.19 | 1.06% |
| Lumentum Holdings Inc. LUMEHOL 0.5 06/15/2028 FIX USD Corporate 144A | 2.19% | 783.81 | 3.91% |
| Mirum Pharmaceuticals, Inc. MIRUPHA 4.0 05/01/2029 FIX USD Corporate 144A | 1.93% | 342.83 | 0.19% |
| Advanced Energy Industries, Inc. AEIS 2.5 09/15/2028 FIX USD Corporate | 1.89% | 251.97 | -0.08% |
| Western Digital Corporation WDC 3.0 11/15/2028 FIX USD Corporate 144A | 1.88% | 1297.53 | 0.99% |
| Tetra Tech, Inc. TETRTEC 2.25 08/15/2028 FIX USD Corporate 144A | 1.84% | 103.56 | -1.56% |
| Merit Medical Systems, Inc. MERIMED 02/01/2029 FIX USD Corporate 144A (Converted) | 1.76% | 106.36 | -0.74% |
| QXO, Inc. QXOINC 5.5 05/15/2028 FIX USD Corporate | 1.75% | 48.30 | -3.44% |
Fees & Availability
| Fees | |
| Actual 12B-1 Fee | 0.25% |
| Actual Management Fee | 0.55% |
| Administration Fee | -- |
| Maximum Front Load | 5.50% |
| Maximum Deferred Load | -- |
| Maximum Redemption Fee | -- |
| General Availability | |
| Available for Insurance Product | No |
| Available for RRSP | No |
| Purchase Details | |
| Open to New Investors |
|
| Minimum Initial Investment | 15000.00 None |
| Minimum Subsequent Investment | 0.00 None |
Basic Info
| Investment Strategy | |
| The Fund seeks capital appreciation together with current income. The Fund invests at least 80% of its assets in convertible securities like bonds, debentures, corporate notes, preferred stocks or other securities that are convertible to common stock or the cash value of a stock or a basket or index of equity securities. |
| General | |
| Security Type | Mutual Fund |
| Equity Style | -- |
| Broad Asset Class | Allocation |
| Broad Category | Fixed Income |
| Global Peer Group | Bond Convertibles US |
| Peer Group | Convertible Securities Funds |
| Global Macro | Bond Other |
| US Macro | Mixed-Assets Funds |
| YCharts Categorization | -- |
| YCharts Benchmark | -- |
| Prospectus Objective | Convertible Securities Funds |
| Fund Owner Firm Name | New York Life Investments |
| Broad Asset Class Benchmark Index | |
| ^SPXTR | 100.0% |
Fundamentals
| General | |
| Distribution Yield | -- |
| Dividend Yield TTM (5-12-26) | 2.14% |
| 30-Day SEC Yield (3-31-26) | 0.94% |
| 7-Day SEC Yield | -- |
| Number of Holdings | 108 |
| Bond | |
| Yield to Maturity (11-30-25) | -3.13% |
| Effective Duration | 3.00 |
| Average Coupon | 2.01% |
| Calculated Average Quality | 4.055 |
| Effective Maturity | 3.270 |
| Nominal Maturity | 3.270 |
| Number of Bond Holdings | 96 |
As of November 30, 2025
Fund Details
Top Portfolio Holders
| Name | % Weight |
|---|---|
| Portfolio A | 5.00% |
| Portfolio B | 3.50% |
| Portfolio C | 2.25% |
Excel Add-In Codes
| Name: =YCI("M:MCOAX", "name") |
| Broad Asset Class: =YCI("M:MCOAX", "broad_asset_class") |
| Broad Category: =YCI("M:MCOAX", "broad_category_group") |
| Prospectus Objective: =YCI("M:MCOAX", "prospectus_objective") |
| To find the codes for any of our securities and financial metrics, see our Complete Excel Reference. |