

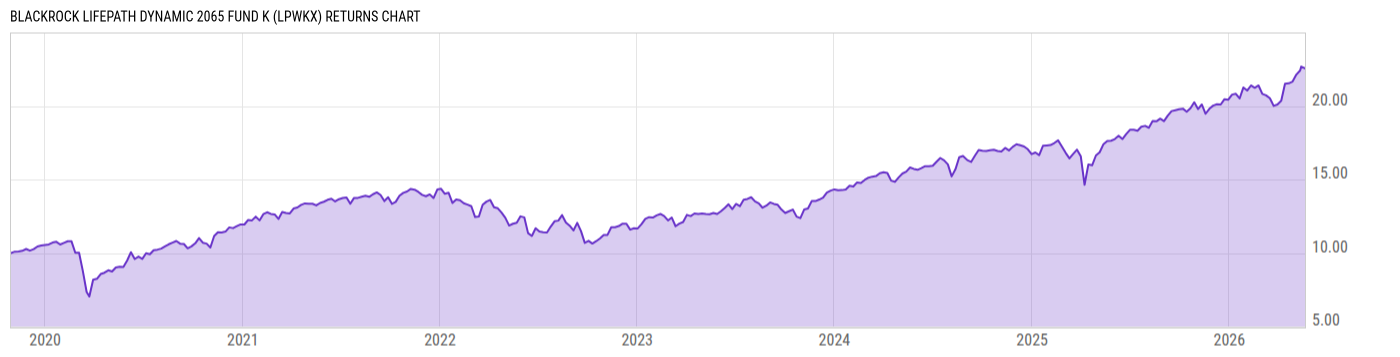
BlackRock LifePath Dynamic 2065 Fund K (LPWKX)
16.93
-0.04
(-0.24%)
USD |
Jun 09 2026
Returns Chart
Key Stats
| Net Expense Ratio | Total Assets Under Management | Weighted Average Dividend Yield | Turnover Ratio (Generic) |
|---|---|---|---|
| 0.34% | 102.38M | -- | 21.00% |
| 1 Year Fund Level Flows | 1 Year Total Returns (Daily) | Annualized Total Returns Since Inception (Daily) | Max Drawdown (Since Inception) |
| 31.41M | 24.96% |
Basic Info
| Investment Strategy | |
| The Fund seeks to provide for retirement outcomes based on quantitatively measured risk. It invests in affiliated open-end funds and affiliated ETFs, some of which may be index funds. The investments in equity securities primarily consist of common stock but may also include preferred stock and convertible securities. |
| General | |
| Security Type | Mutual Fund |
| Equity Style | -- |
| Broad Asset Class | Allocation |
| Broad Category | Allocation |
| Global Peer Group | Target Maturity MA USD 2060+ |
| Peer Group | Mixed-Asset Target 2060+ Funds |
| Global Macro | Target Maturity |
| US Macro | Mixed-Assets Target Date Funds |
| YCharts Categorization | -- |
| YCharts Benchmark | -- |
| Prospectus Objective | Growth Funds |
| Fund Owner Firm Name | BlackRock |
| Broad Asset Class Benchmark Index | |
| ^SPXTR | 100.0% |
Net Fund Flows Versus Peer Group
1 Month
% Rank:
30
-39.17M
Peer Group Low
216.79M
Peer Group High
1 Year
% Rank:
39
31.41M
-7.726M
Peer Group Low
2.718B
Peer Group High
3 Months
% Rank:
41
-19.51M
Peer Group Low
798.19M
Peer Group High
3 Years
% Rank:
37
187376.0
Peer Group Low
6.729B
Peer Group High
6 Months
% Rank:
42
-19.82M
Peer Group Low
1.620B
Peer Group High
5 Years
% Rank:
43
187376.0
Peer Group Low
8.620B
Peer Group High
YTD
% Rank:
44
-25.54M
Peer Group Low
1.422B
Peer Group High
10 Years
% Rank:
40
187376.0
Peer Group Low
9.652B
Peer Group High
Date Unavailable
Risk
Performance Versus Peer Group
Annual Total Returns Versus Peers
As of June 10, 2026.
Asset Allocation
As of December 31, 2025.
| Type | % Net |
|---|---|
| Cash | -5.62% |
| Stock | 25.13% |
| Bond | 5.73% |
| Convertible | 0.00% |
| Preferred | 0.19% |
| Other | 74.58% |
Top 10 Holdings
| Name | % Weight | Price | % Change |
|---|---|---|---|
|
DIVERSIFIED EQUITY MASTER FUND
|
49.51% | -- | -- |
|
INTERNATIONAL TILTS MASTER PORTFOLIO
|
14.58% | -- | -- |
| iShares Core MSCI Emerging Markets ETF | 10.70% | 78.60 | -1.80% |
| iShares Core MSCI International Developed Mkt ETF | 7.13% | 87.54 | -1.37% |
|
M EMINI JUN26
|
4.98% | -- | -- |
| BlackRock Tactical Opportunities Fund K | 4.88% | 17.35 | -0.23% |
| BlackRock Cash Funds: Treasury SL Agency | 4.88% | 1.00 | 0.00% |
|
1RTY JUN26
|
2.56% | -- | -- |
| iShares MSCI Canada ETF | 2.22% | 57.69 | -0.59% |
| iShares MSCI EAFE Small-Cap ETF | 2.06% | 82.71 | -1.32% |
Fees & Availability
| Fees | |
| Actual 12B-1 Fee | -- |
| Actual Management Fee | 0.04% |
| Administration Fee | 17.18K% |
| Maximum Front Load | -- |
| Maximum Deferred Load | -- |
| Maximum Redemption Fee | -- |
| General Availability | |
| Available for Insurance Product | No |
| Available for RRSP | No |
| Purchase Details | |
| Open to New Investors |
|
| Minimum Initial Investment | 5.00M None |
| Minimum Subsequent Investment | 0.00 None |
Basic Info
| Investment Strategy | |
| The Fund seeks to provide for retirement outcomes based on quantitatively measured risk. It invests in affiliated open-end funds and affiliated ETFs, some of which may be index funds. The investments in equity securities primarily consist of common stock but may also include preferred stock and convertible securities. |
| General | |
| Security Type | Mutual Fund |
| Equity Style | -- |
| Broad Asset Class | Allocation |
| Broad Category | Allocation |
| Global Peer Group | Target Maturity MA USD 2060+ |
| Peer Group | Mixed-Asset Target 2060+ Funds |
| Global Macro | Target Maturity |
| US Macro | Mixed-Assets Target Date Funds |
| YCharts Categorization | -- |
| YCharts Benchmark | -- |
| Prospectus Objective | Growth Funds |
| Fund Owner Firm Name | BlackRock |
| Broad Asset Class Benchmark Index | |
| ^SPXTR | 100.0% |
Fundamentals
| General | |
| Distribution Yield | -- |
| Dividend Yield TTM (6-8-26) | 2.49% |
| 30-Day SEC Yield | -- |
| 7-Day SEC Yield | -- |
| Number of Holdings | 10 |
| Stock | |
| Weighted Average PE Ratio | 25.69 |
| Weighted Average Price to Sales Ratio | 5.427 |
| Weighted Average Price to Book Ratio | 5.218 |
| Weighted Median ROE | 32.40% |
| Weighted Median ROA | 7.98% |
| ROI (TTM) | 13.53% |
| Return on Investment (TTM) | 13.53% |
| Earning Yield | 0.0553 |
| LT Debt / Shareholders Equity | 0.7151 |
| Number of Equity Holdings | 0 |
| Bond | |
| Yield to Maturity (12-31-25) | 4.54% |
| Effective Duration | -0.01 |
| Average Coupon | 4.64% |
| Calculated Average Quality | 3.341 |
| Effective Maturity | 4.765 |
| Nominal Maturity | 4.894 |
| Number of Bond Holdings | 0 |
As of December 31, 2025
Growth Metrics
| EPS Growth (1Y) | 25.11% |
| EPS Growth (3Y) | 11.80% |
| EPS Growth (5Y) | 15.45% |
| Sales Growth (1Y) | 12.51% |
| Sales Growth (3Y) | 11.48% |
| Sales Growth (5Y) | 11.72% |
| Sales per Share Growth (1Y) | 22.26% |
| Sales per Share Growth (3Y) | 11.26% |
| Operating Cash Flow - Growth Rate (3Y) | 15.71% |
As of December 31, 2025
Fund Details
Top Portfolio Holders
| Name | % Weight |
|---|---|
| Portfolio A | 5.00% |
| Portfolio B | 3.50% |
| Portfolio C | 2.25% |
Excel Add-In Codes
| Name: =YCI("M:LPWKX", "name") |
| Broad Asset Class: =YCI("M:LPWKX", "broad_asset_class") |
| Broad Category: =YCI("M:LPWKX", "broad_category_group") |
| Prospectus Objective: =YCI("M:LPWKX", "prospectus_objective") |
| To find the codes for any of our securities and financial metrics, see our Complete Excel Reference. |