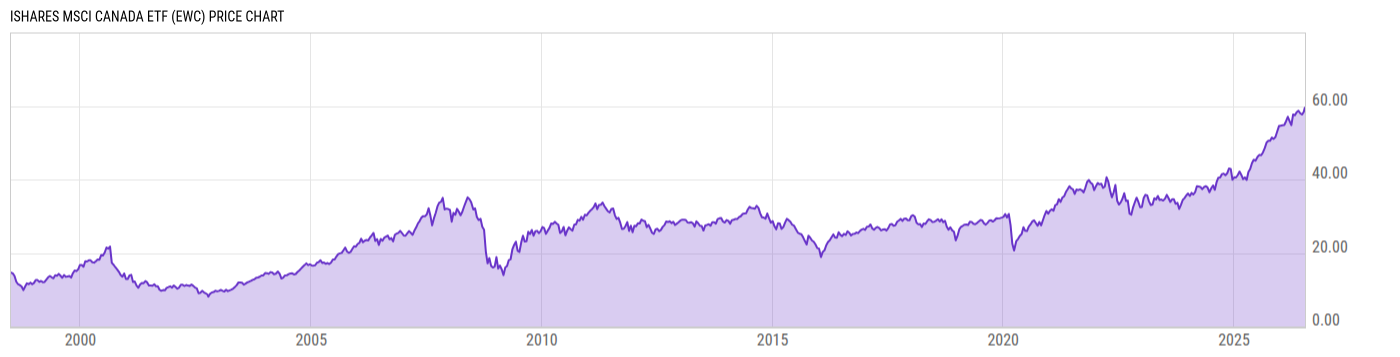
iShares MSCI Canada ETF (EWC)
31.84
-0.33 (-1.03%)
USD |
Jan 15, 16:58
Price Chart
Key Stats
Customize
Expense Ratio | Discount or Premium to NAV | Total Assets Under Management | 30-Day Average Daily Volume |
---|---|---|---|
0.51% | 0.19% | 2.970B | 2.529M |
Dividend Yield | Turnover Ratio | 1 Year Fund Level Flows | Max Drawdown (All) |
2.02% | 9.00% | -204.78M | Upgrade |
Basic Info
Investment Strategy | |
The investment seeks to track the investment results of the MSCI Canada Custom Capped Index. The fund will at all times invest at least 90% of its assets in the securities of its underlying index and in depositary receipts representing securities in its underlying index. The underlying index is designed to measure broad-based equity performance in Canada. The underlying index uses a capping methodology to limit the weight of any single issuer to a maximum of 25% of the underlying index. The underlying index will include large- and mid-capitalization companies and may change over time. |
General | |
Security Type | Exchange-Traded Fund |
Equity Style | Large Cap/Blend |
Fixed Income Style | -- |
Broad Asset Class | International Equity |
Broad Category | Equity |
Category Name | Miscellaneous Region |
Category Index | MSCI ACWI Ex USA NR USD |
Prospectus Objective | Foreign Stock |
Fund Owner Firm Name | iShares |
Prospectus Benchmark Index | |
MSCI Canada Custom Capped NR USD | 100.0% |
Broad Asset Class Benchmark Index | |
^MSACXUSNTR | 100.0% |
Manager Tenure | |
Greg Savage | 13.01 yrs |
Jennifer Hsui | 8.01 yrs |
Alan Mason | 4.72 yrs |
Amy Whitelaw | 2.01 yrs |
Rachel Aguirre | 2.01 yrs |
Net Fund Flows Versus Category
1 Month
% Rank:
--
--
Category Low
--
Category High
1 Year
% Rank:
100
-204.78M
-228.86M
Category Low
1.880B
Category High
3 Months
% Rank:
--
--
Category Low
--
Category High
3 Years
% Rank:
--
--
Category Low
--
Category High
6 Months
% Rank:
--
--
Category Low
--
Category High
5 Years
% Rank:
--
--
Category Low
--
Category High
YTD
% Rank:
--
--
Category Low
--
Category High
10 Years
% Rank:
--
--
Category Low
--
Category High
As of December 31, 2020
Performance Versus Category
As of January 14, 2021. Returns for periods of 1 year and above are annualized.
Annual Total Returns Versus Peers
Edit comparables
As of January 14, 2021.
Asset Allocation
Top 10 Holdings
Name | % Weight | Price | % Change |
---|---|---|---|
Shopify Inc A | 7.72% | 1490.95 | 0.15% |
Royal Bank of Canada | 7.42% | 108.40 | 0.20% |
The Toronto-Dominion Bank | 6.47% | 75.42 | -0.24% |
Canadian National Railway Co | 4.25% | 142.12 | 0.08% |
Bank of Nova Scotia | 4.06% | 70.21 | 0.36% |
Enbridge Inc | 3.87% | 44.88 | -0.31% |
Bank of Montreal | 3.11% | 100.63 | 1.14% |
Canadian Pacific Railway Ltd | 3.06% | 454.23 | 0.62% |
Brookfield Asset Management Inc Class A | 3.03% | 49.32 | 0.98% |
Barrick Gold Corp | 2.61% | 29.46 | -1.50% |
News
Headline
Wire
Time (ET)
SA Breaking News
10/28 10:01
Basic Info
Investment Strategy | |
The investment seeks to track the investment results of the MSCI Canada Custom Capped Index. The fund will at all times invest at least 90% of its assets in the securities of its underlying index and in depositary receipts representing securities in its underlying index. The underlying index is designed to measure broad-based equity performance in Canada. The underlying index uses a capping methodology to limit the weight of any single issuer to a maximum of 25% of the underlying index. The underlying index will include large- and mid-capitalization companies and may change over time. |
General | |
Security Type | Exchange-Traded Fund |
Equity Style | Large Cap/Blend |
Fixed Income Style | -- |
Broad Asset Class | International Equity |
Broad Category | Equity |
Category Name | Miscellaneous Region |
Category Index | MSCI ACWI Ex USA NR USD |
Prospectus Objective | Foreign Stock |
Fund Owner Firm Name | iShares |
Prospectus Benchmark Index | |
MSCI Canada Custom Capped NR USD | 100.0% |
Broad Asset Class Benchmark Index | |
^MSACXUSNTR | 100.0% |
Manager Tenure | |
Greg Savage | 13.01 yrs |
Jennifer Hsui | 8.01 yrs |
Alan Mason | 4.72 yrs |
Amy Whitelaw | 2.01 yrs |
Rachel Aguirre | 2.01 yrs |
Fundamentals
General | |
Distribution Yield | Upgrade |
Dividend Yield TTM (1-15-21) | 2.02% |
30-Day SEC Yield (3-31-20) | Upgrade |
7-Day SEC Yield | -- |
Number of Holdings | Upgrade |
Stock | |
Weighted Average PE Ratio | 17.66 |
Weighted Average Price to Sales Ratio | Upgrade |
Weighted Average Price to Book Ratio | Upgrade |
Weighted Median ROE | Upgrade |
Weighted Median ROA | Upgrade |
Forecasted Dividend Yield | Upgrade |
Forecasted PE Ratio | Upgrade |
Forecasted Price to Sales Ratio | Upgrade |
Forecasted Price to Book Ratio | Upgrade |
As of January 14, 2021
Growth Estimates
Fund Details
Key Dates | |
Inception Date | 3/12/1996 |
Last Annual Report Date | 8/31/2020 |
Last Prospectus Date | 12/30/2020 |
Attributes | |
Enhanced Index Fund | No |
Index Fund |
|
Inverse Fund | No |
Leveraged Fund | No |
Fund of Funds | No |
Currency Hedged Fund | No |
Synthetic Replication Fund | No |
Has Dividend Investment Plan | No |
Socially Responsible Fund | No |
News
Headline
Wire
Time (ET)
SA Breaking News
10/28 10:01