

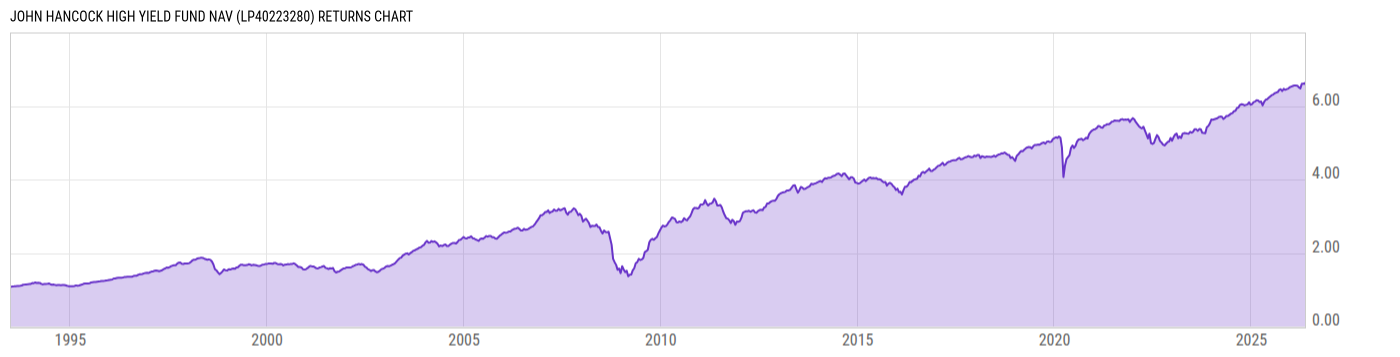
John Hancock High Yield Fund NAV (LP40223280)
3.03
0.00 (0.00%)
USD |
Jun 02 2026
Returns Chart
Key Stats
| Net Expense Ratio | Total Assets Under Management | Weighted Average Dividend Yield | Turnover Ratio (Generic) |
|---|---|---|---|
| 0.55% | 1.978B | -- | 54.00% |
| 1 Year Fund Level Flows | 1 Year Total Returns (Daily) | Annualized Total Returns Since Inception (Daily) | Max Drawdown (Since Inception) |
| 478.42M | 7.04% |
Basic Info
| Investment Strategy | |
| The Fund seeks high current income. Capital appreciation is a secondary goal. The Fund invests, under normal market conditions, at least 80% of its net assets (plus any borrowings made for investment purposes) in US and foreign fixed-income securities rated BB or lower and their unrated equivalents. |
| General | |
| Security Type | Mutual Fund |
| Equity Style | -- |
| Broad Asset Class | Taxable Bond |
| Broad Category | Fixed Income |
| Global Peer Group | Bond USD High Yield |
| Peer Group | High Yield Funds |
| Global Macro | Bond High Yield |
| US Macro | High Yield Funds |
| YCharts Categorization | -- |
| YCharts Benchmark | -- |
| Prospectus Objective | High Yield Funds |
| Fund Owner Firm Name | John Hancock Group |
| Broad Asset Class Benchmark Index | |
| ^BBUSATR | 100.0% |
Net Fund Flows Versus Peer Group
1 Month
% Rank:
17
-2.560B
Peer Group Low
510.03M
Peer Group High
1 Year
% Rank:
9
478.42M
-2.841B
Peer Group Low
12.05B
Peer Group High
3 Months
% Rank:
8
-2.713B
Peer Group Low
900.82M
Peer Group High
3 Years
% Rank:
18
-4.326B
Peer Group Low
13.55B
Peer Group High
6 Months
% Rank:
8
-2.877B
Peer Group Low
1.236B
Peer Group High
5 Years
% Rank:
23
-9.174B
Peer Group Low
14.79B
Peer Group High
YTD
% Rank:
7
-4.190B
Peer Group Low
1.049B
Peer Group High
10 Years
% Rank:
24
-9.701B
Peer Group Low
21.92B
Peer Group High
Date Unavailable
Risk
Performance Versus Peer Group
Annual Total Returns Versus Peers
As of June 03, 2026.
Asset Allocation
As of March 31, 2026.
| Type | % Net |
|---|---|
| Cash | -0.26% |
| Stock | 0.00% |
| Bond | 97.29% |
| Convertible | 0.00% |
| Preferred | 0.05% |
| Other | 2.92% |
Top 10 Holdings
| Name | % Weight | Price | % Change |
|---|---|---|---|
|
John Hancock Collateral Trust
|
7.27% | -- | -- |
| ROCKET COMPANIES, INC. ROCKETC 6.125 08/01/2030 FIX USD Corporate 144A | 0.82% | 101.01 | -0.53% |
| Discovery Global Holdings, Inc. DISCGLO 4.279 03/15/2032 FIX USD Corporate | 0.79% | 91.31 | -0.00% |
| Caesars Entertainment, Inc. CAESARE 6.5 02/15/2032 FIX USD Corporate 144A | 0.78% | 98.02 | -0.12% |
| 1261229 B.C. LTD. BCEC 10.0 04/15/2032 FIX USD Corporate 144A | 0.72% | 101.97 | -0.43% |
| Venture Global LNG, Inc. VENTUGL 9.0 12/31/2099 FLT USD Corporate 144A '29 | 0.71% | 99.41 | -0.04% |
| TransDigm Inc. TRADIG 4.875 05/01/2029 FIX USD Corporate | 0.66% | 98.63 | -0.32% |
| Newell Brands Inc. NEWEBRA 8.5 06/01/2028 FIX USD Corporate 144A | 0.63% | 104.34 | -0.16% |
| Caesars Entertainment, Inc. CAESARE 7.0 02/15/2030 FIX USD Corporate 144A | 0.62% | 101.20 | -0.05% |
| MEDLINE BORROWER, LP MEDLBOR 5.25 10/01/2029 FIX USD Corporate 144A | 0.60% | 99.65 | -0.20% |
Fees & Availability
| Fees | |
| Actual 12B-1 Fee | -- |
| Actual Management Fee | 0.49% |
| Administration Fee | -- |
| Maximum Front Load | -- |
| Maximum Deferred Load | -- |
| Maximum Redemption Fee | -- |
| General Availability | |
| Available for Insurance Product | No |
| Available for RRSP | No |
| Purchase Details | |
| Open to New Investors |
|
| Minimum Initial Investment | 0.00 None |
| Minimum Subsequent Investment | 0.00 None |
Basic Info
| Investment Strategy | |
| The Fund seeks high current income. Capital appreciation is a secondary goal. The Fund invests, under normal market conditions, at least 80% of its net assets (plus any borrowings made for investment purposes) in US and foreign fixed-income securities rated BB or lower and their unrated equivalents. |
| General | |
| Security Type | Mutual Fund |
| Equity Style | -- |
| Broad Asset Class | Taxable Bond |
| Broad Category | Fixed Income |
| Global Peer Group | Bond USD High Yield |
| Peer Group | High Yield Funds |
| Global Macro | Bond High Yield |
| US Macro | High Yield Funds |
| YCharts Categorization | -- |
| YCharts Benchmark | -- |
| Prospectus Objective | High Yield Funds |
| Fund Owner Firm Name | John Hancock Group |
| Broad Asset Class Benchmark Index | |
| ^BBUSATR | 100.0% |
Fundamentals
| General | |
| Distribution Yield | -- |
| Dividend Yield TTM (6-2-26) | 6.92% |
| 30-Day SEC Yield (4-30-26) | 6.52% |
| 7-Day SEC Yield | -- |
| Number of Holdings | 585 |
| Bond | |
| Yield to Maturity (3-31-26) | 7.11% |
| Effective Duration | 2.94 |
| Average Coupon | 6.93% |
| Calculated Average Quality | 5.628 |
| Effective Maturity | 4.684 |
| Nominal Maturity | 5.455 |
| Number of Bond Holdings | 575 |
As of March 31, 2026
Fund Details
Top Portfolio Holders
| Name | % Weight |
|---|---|
| Portfolio A | 5.00% |
| Portfolio B | 3.50% |
| Portfolio C | 2.25% |
Excel Add-In Codes
| Name: =YCI("M:LP40223280", "name") |
| Broad Asset Class: =YCI("M:LP40223280", "broad_asset_class") |
| Broad Category: =YCI("M:LP40223280", "broad_category_group") |
| Prospectus Objective: =YCI("M:LP40223280", "prospectus_objective") |
| To find the codes for any of our securities and financial metrics, see our Complete Excel Reference. |