

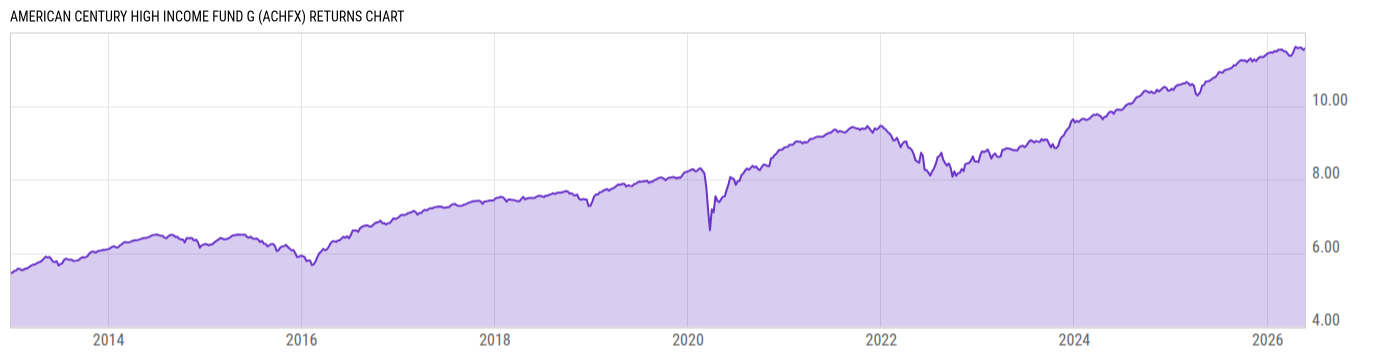
American Century High Income Fund G (ACHFX)
8.66
+0.01
(+0.12%)
USD |
May 22 2026
Returns Chart
Key Stats
| Net Expense Ratio | Total Assets Under Management | Weighted Average Dividend Yield | Turnover Ratio (Generic) |
|---|---|---|---|
| 0.00% | 1.859B | -- | 35.00% |
| 1 Year Fund Level Flows | 1 Year Total Returns (Daily) | Annualized Total Returns Since Inception (Daily) | Max Drawdown (Since Inception) |
| -197.28M | 8.65% |
Basic Info
| Investment Strategy | |
| The Fund seeks to achieve current yield and capital growth. The Fund will invest at least 80% of its assets in a portfolio of high yield bonds rated below investment grade by Moody's Investors Services Inc., Standard & Poors Rating Services, or Fitch, Inc., or if determined to be of comparable quality. |
| General | |
| Security Type | Mutual Fund |
| Equity Style | -- |
| Broad Asset Class | Taxable Bond |
| Broad Category | Fixed Income |
| Global Peer Group | Bond USD High Yield |
| Peer Group | High Yield Funds |
| Global Macro | Bond High Yield |
| US Macro | High Yield Funds |
| YCharts Categorization | -- |
| YCharts Benchmark | -- |
| Prospectus Objective | High Yield Funds |
| Fund Owner Firm Name | American Century Investments |
| Broad Asset Class Benchmark Index | |
| ^BBUSATR | 100.0% |
Net Fund Flows Versus Peer Group
1 Month
% Rank:
84
-246.22M
Peer Group Low
1.905B
Peer Group High
1 Year
% Rank:
83
-197.28M
-2.757B
Peer Group Low
12.05B
Peer Group High
3 Months
% Rank:
84
-1.206B
Peer Group Low
754.76M
Peer Group High
3 Years
% Rank:
92
-4.269B
Peer Group Low
12.80B
Peer Group High
6 Months
% Rank:
76
-2.219B
Peer Group Low
1.746B
Peer Group High
5 Years
% Rank:
81
-7.728B
Peer Group Low
14.73B
Peer Group High
YTD
% Rank:
82
-3.074B
Peer Group Low
1.049B
Peer Group High
10 Years
% Rank:
21
-10.71B
Peer Group Low
21.54B
Peer Group High
Date Unavailable
Risk
Performance Versus Peer Group
Annual Total Returns Versus Peers
As of May 23, 2026.
Asset Allocation
As of March 31, 2026.
| Type | % Net |
|---|---|
| Cash | 0.43% |
| Stock | 0.41% |
| Bond | 98.32% |
| Convertible | 0.00% |
| Preferred | 0.00% |
| Other | 0.84% |
Top 10 Holdings
| Name | % Weight | Price | % Change |
|---|---|---|---|
|
OTHER ASSETS LESS LIABILITIES
|
0.84% | -- | -- |
| State Street US Government Money Market Fund Prem | 0.72% | 1.00 | 0.00% |
| 1261229 B.C. LTD. BCEC 10.0 04/15/2032 FIX USD Corporate 144A | 0.57% | 102.38 | 0.02% |
| TransDigm Inc. TRADIG 6.375 05/31/2033 FIX USD Corporate 144A | 0.50% | 100.55 | 0.12% |
| CCO Holdings, LLC CHTR-CCOH 4.75 02/01/2032 FIX USD Corporate 144A | 0.44% | 88.87 | 0.21% |
| Allied Universal Holdco LLC ALLIUNI 6.0 06/01/2029 FIX USD Corporate 144A | 0.44% | 98.81 | 0.10% |
| DIRECTV FINANCING, LLC DIRFIN 10.0 02/15/2031 FIX USD Corporate 144A | 0.39% | 103.75 | 0.42% |
| PICARD MIDCO, INC. PICAMID 6.5 03/31/2029 FIX USD Corporate 144A | 0.38% | 99.04 | 0.04% |
| Imola Merger Corporation IMOLMER 4.75 05/15/2029 FIX USD Corporate 144A | 0.37% | 97.60 | -0.08% |
| ATHENAHEALTH GROUP INC. ATHENGR 6.5 02/15/2030 FIX USD Corporate 144A | 0.37% | 95.91 | -0.01% |
Fees & Availability
| Fees | |
| Actual 12B-1 Fee | -- |
| Actual Management Fee | 0.00% |
| Administration Fee | -- |
| Maximum Front Load | -- |
| Maximum Deferred Load | -- |
| Maximum Redemption Fee | -- |
| General Availability | |
| Available for Insurance Product | No |
| Available for RRSP | No |
| Purchase Details | |
| Open to New Investors |
|
| Minimum Initial Investment | 0.00 None |
| Minimum Subsequent Investment | 0.00 None |
Basic Info
| Investment Strategy | |
| The Fund seeks to achieve current yield and capital growth. The Fund will invest at least 80% of its assets in a portfolio of high yield bonds rated below investment grade by Moody's Investors Services Inc., Standard & Poors Rating Services, or Fitch, Inc., or if determined to be of comparable quality. |
| General | |
| Security Type | Mutual Fund |
| Equity Style | -- |
| Broad Asset Class | Taxable Bond |
| Broad Category | Fixed Income |
| Global Peer Group | Bond USD High Yield |
| Peer Group | High Yield Funds |
| Global Macro | Bond High Yield |
| US Macro | High Yield Funds |
| YCharts Categorization | -- |
| YCharts Benchmark | -- |
| Prospectus Objective | High Yield Funds |
| Fund Owner Firm Name | American Century Investments |
| Broad Asset Class Benchmark Index | |
| ^BBUSATR | 100.0% |
Fundamentals
| General | |
| Distribution Yield | -- |
| Dividend Yield TTM (5-21-26) | 7.37% |
| 30-Day SEC Yield (4-30-26) | 6.96% |
| 7-Day SEC Yield | -- |
| Number of Holdings | 10 |
| Bond | |
| Yield to Maturity (3-31-26) | 6.41% |
| Effective Duration | 2.98 |
| Average Coupon | 6.91% |
| Calculated Average Quality | 5.680 |
| Effective Maturity | 4.795 |
| Nominal Maturity | 5.293 |
| Number of Bond Holdings | 8 |
As of March 31, 2026
Fund Details
| Key Dates | |
| Inception Date | 5/19/2022 |
| Last Annual Report Date | 3/31/2025 |
| Last Prospectus Date | 8/1/2025 |
| Share Classes | |
| AHIAX | A |
| AHIDX | Retirement |
| AHIEX | Retirement |
| AHIIX | Inst |
| AHIVX | Inv |
| NPHIX | Inst |
| Attributes | |
| Index Fund | -- |
| Inverse Fund | No |
| Leveraged Fund | -- |
| Fund of Funds | No |
| Currency Hedged Fund | -- |
| Socially Responsible Fund | No |
Top Portfolio Holders
| Name | % Weight |
|---|---|
| Portfolio A | 5.00% |
| Portfolio B | 3.50% |
| Portfolio C | 2.25% |
Excel Add-In Codes
| Name: =YCI("M:ACHFX", "name") |
| Broad Asset Class: =YCI("M:ACHFX", "broad_asset_class") |
| Broad Category: =YCI("M:ACHFX", "broad_category_group") |
| Prospectus Objective: =YCI("M:ACHFX", "prospectus_objective") |
| To find the codes for any of our securities and financial metrics, see our Complete Excel Reference. |