

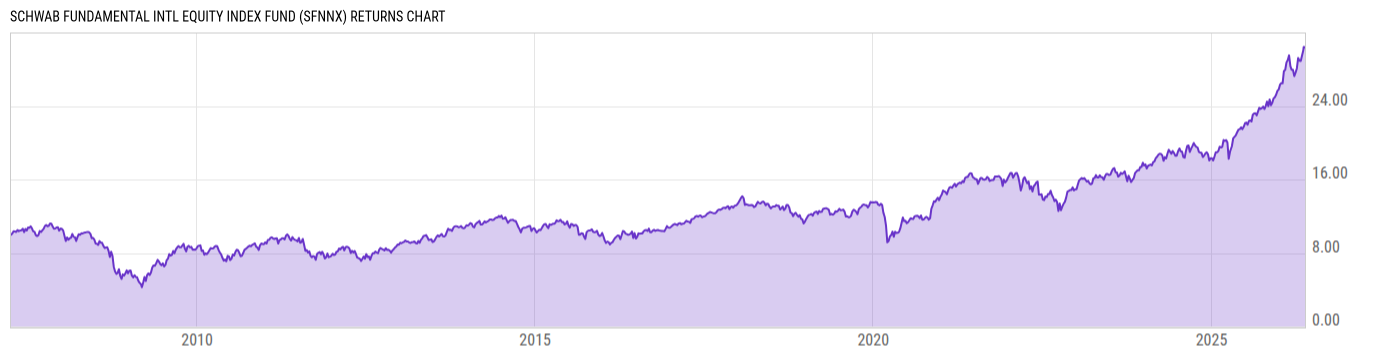
Schwab Fundamental Intl Equity Index Fund (SFNNX)
16.35
-0.06
(-0.37%)
USD |
May 22 2026
Returns Chart
Key Stats
| Net Expense Ratio | Total Assets Under Management | Weighted Average Dividend Yield | Turnover Ratio (Generic) |
|---|---|---|---|
| 0.25% | 5.032B | 2.93% | 20.00% |
| 1 Year Fund Level Flows | 1 Year Total Returns (Daily) | Annualized Total Returns Since Inception (Daily) | Max Drawdown (Since Inception) |
| 203.14M | 43.20% |
Basic Info
| Investment Strategy | |
| The Fund seeks to track as closely as possible the total return of an index that measures the performance of large non-U.S. developed market companies based on their fundamental size and weight. The fund generally invests in stocks that are included in the RAFI Fundamental High Liquidity Developed US Large Index. |
| General | |
| Security Type | Mutual Fund |
| Equity Style | Large Cap Value |
| Broad Asset Class | International Equity |
| Broad Category | Equity |
| Global Peer Group | Equity Global ex US |
| Peer Group | International Large-Cap Value |
| Global Macro | Equity Global |
| US Macro | Developed International Markets Funds |
| YCharts Categorization | -- |
| YCharts Benchmark | -- |
| Prospectus Objective | International Funds |
| Fund Owner Firm Name | Charles Schwab |
| Broad Asset Class Benchmark Index | |
| ^MSACXUSNTR | 100.0% |
Net Fund Flows Versus Peer Group
1 Month
% Rank:
18
-201.34M
Peer Group Low
648.19M
Peer Group High
1 Year
% Rank:
27
203.14M
-3.790B
Peer Group Low
2.609B
Peer Group High
3 Months
% Rank:
17
-1.270B
Peer Group Low
1.042B
Peer Group High
3 Years
% Rank:
18
-7.054B
Peer Group Low
5.781B
Peer Group High
6 Months
% Rank:
17
-2.370B
Peer Group Low
1.742B
Peer Group High
5 Years
% Rank:
18
-6.567B
Peer Group Low
6.639B
Peer Group High
YTD
% Rank:
15
-1.257B
Peer Group Low
1.482B
Peer Group High
10 Years
% Rank:
23
-37.13B
Peer Group Low
11.66B
Peer Group High
Date Unavailable
Risk
Performance Versus Peer Group
Annual Total Returns Versus Peers
As of May 23, 2026.
Asset Allocation
As of March 31, 2026.
| Type | % Net |
|---|---|
| Cash | -0.02% |
| Stock | 97.52% |
| Bond | 0.00% |
| Convertible | 0.00% |
| Preferred | 1.20% |
| Other | 1.30% |
Top 10 Holdings
| Name | % Weight | Price | % Change |
|---|---|---|---|
| Samsung Electronics Co., Ltd. | 4.10% | 140.00 | 0.00% |
| Shell Plc | 2.46% | 44.25 | 1.33% |
| TotalEnergies SE | 1.86% | 91.60 | -0.81% |
| Glencore Plc | 1.29% | 7.63 | -1.23% |
| BP Plc | 1.26% | 7.75 | 0.00% |
| BHP Group Ltd. | 1.11% | 42.00 | 0.95% |
| HSBC Holdings Plc | 1.02% | 18.13 | 2.73% |
|
MSCI EAFE JUN6
|
0.97% | -- | -- |
| Toyota Motor Corp. | 0.93% | 19.50 | 3.07% |
| Roche Holding AG | 0.82% | 425.00 | 0.56% |
Fees & Availability
| Fees | |
| Actual 12B-1 Fee | -- |
| Actual Management Fee | 0.25% |
| Administration Fee | -- |
| Maximum Front Load | -- |
| Maximum Deferred Load | -- |
| Maximum Redemption Fee | 0.00% |
| General Availability | |
| Available for Insurance Product | No |
| Available for RRSP | No |
| Purchase Details | |
| Open to New Investors |
|
| Minimum Initial Investment | 0.00 None |
| Minimum Subsequent Investment | 0.00 None |
Basic Info
| Investment Strategy | |
| The Fund seeks to track as closely as possible the total return of an index that measures the performance of large non-U.S. developed market companies based on their fundamental size and weight. The fund generally invests in stocks that are included in the RAFI Fundamental High Liquidity Developed US Large Index. |
| General | |
| Security Type | Mutual Fund |
| Equity Style | Large Cap Value |
| Broad Asset Class | International Equity |
| Broad Category | Equity |
| Global Peer Group | Equity Global ex US |
| Peer Group | International Large-Cap Value |
| Global Macro | Equity Global |
| US Macro | Developed International Markets Funds |
| YCharts Categorization | -- |
| YCharts Benchmark | -- |
| Prospectus Objective | International Funds |
| Fund Owner Firm Name | Charles Schwab |
| Broad Asset Class Benchmark Index | |
| ^MSACXUSNTR | 100.0% |
Fundamentals
| General | |
| Distribution Yield | -- |
| Dividend Yield TTM (5-21-26) | 3.06% |
| 30-Day SEC Yield | -- |
| 7-Day SEC Yield | -- |
| Number of Holdings | 903 |
| Stock | |
| Weighted Average PE Ratio | 20.74 |
| Weighted Average Price to Sales Ratio | 2.097 |
| Weighted Average Price to Book Ratio | 2.480 |
| Weighted Median ROE | 12.27% |
| Weighted Median ROA | 4.47% |
| ROI (TTM) | 7.93% |
| Return on Investment (TTM) | 7.93% |
| Earning Yield | 0.0629 |
| LT Debt / Shareholders Equity | 0.7286 |
| Number of Equity Holdings | 884 |
As of March 31, 2026
Growth Metrics
| EPS Growth (1Y) | 13.09% |
| EPS Growth (3Y) | 1.71% |
| EPS Growth (5Y) | 13.23% |
| Sales Growth (1Y) | 3.25% |
| Sales Growth (3Y) | 2.22% |
| Sales Growth (5Y) | 6.95% |
| Sales per Share Growth (1Y) | 4.73% |
| Sales per Share Growth (3Y) | 3.49% |
| Operating Cash Flow - Growth Rate (3Y) | 5.48% |
As of March 31, 2026
Fund Details
| Key Dates | |
| Inception Date | 4/2/2007 |
| Last Annual Report Date | 10/31/2025 |
| Last Prospectus Date | 2/28/2025 |
| Attributes | |
| Index Fund |
|
| Inverse Fund | No |
| Leveraged Fund | -- |
| Fund of Funds | No |
| Currency Hedged Fund | -- |
| Socially Responsible Fund | No |
Top Portfolio Holders
| Name | % Weight |
|---|---|
| Portfolio A | 5.00% |
| Portfolio B | 3.50% |
| Portfolio C | 2.25% |
Excel Add-In Codes
| Name: =YCI("M:SFNNX", "name") |
| Broad Asset Class: =YCI("M:SFNNX", "broad_asset_class") |
| Broad Category: =YCI("M:SFNNX", "broad_category_group") |
| Prospectus Objective: =YCI("M:SFNNX", "prospectus_objective") |
| To find the codes for any of our securities and financial metrics, see our Complete Excel Reference. |