

Voya Solution Balanced Portfolio Adviser (ISGAX)
10.52
+0.01
(+0.10%)
USD |
Jun 09 2026
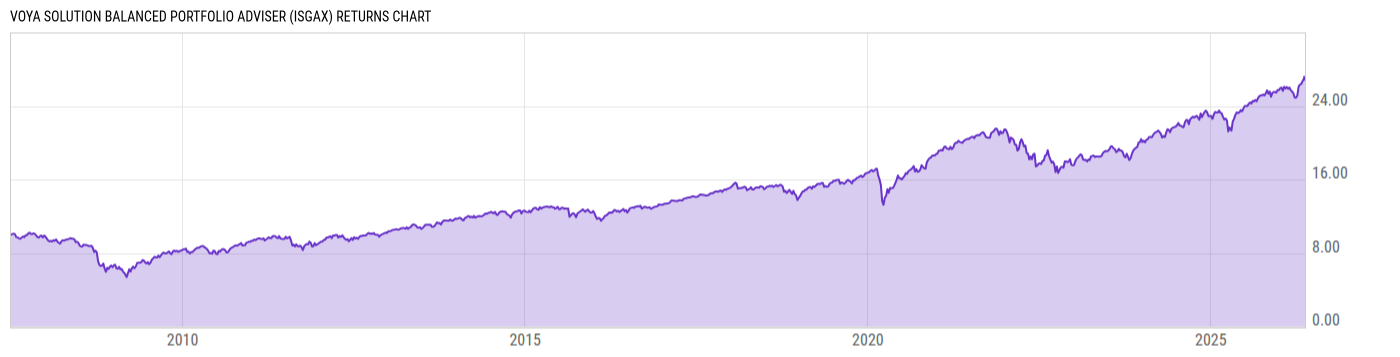
Returns Chart
Key Stats
| Net Expense Ratio | Total Assets Under Management | Weighted Average Dividend Yield | Turnover Ratio (Generic) |
|---|---|---|---|
| 1.25% | 206.69M | -- | 30.00% |
| 1 Year Fund Level Flows | 1 Year Total Returns (Daily) | Annualized Total Returns Since Inception (Daily) | Max Drawdown (Since Inception) |
| -8.661M | 15.31% |
Basic Info
| Investment Strategy | |
| The Fund seeks provide capital growth through a diversified asset allocation strategy. The Portfolio invests in a combination of Underlying Funds which are active U.S. stock, international stock, U.S. bond and other fixed-income investments using asset allocation strategies designed for investors saving for retirement. |
| General | |
| Security Type | Insurance Fund |
| Equity Style | -- |
| Broad Asset Class | Allocation |
| Broad Category | Allocation |
| Global Peer Group | Mixed Asset USD Aggressive |
| Peer Group | Mixed-Asset Target Alloc Growth Funds |
| Global Macro | Mixed Asset HC Aggressive |
| US Macro | Mixed-Assets Target Allocation Funds |
| YCharts Categorization | -- |
| YCharts Benchmark | -- |
| Prospectus Objective | Growth Funds |
| Fund Owner Firm Name | Voya |
| Broad Asset Class Benchmark Index | |
| ^SPXTR | 100.0% |
Net Fund Flows Versus Peer Group
1 Month
% Rank:
34
-859.80M
Peer Group Low
327.50M
Peer Group High
1 Year
% Rank:
20
-8.661M
-13.50B
Peer Group Low
3.669B
Peer Group High
3 Months
% Rank:
33
-5.251B
Peer Group Low
893.21M
Peer Group High
3 Years
% Rank:
22
-27.78B
Peer Group Low
5.767B
Peer Group High
6 Months
% Rank:
29
-9.264B
Peer Group Low
2.137B
Peer Group High
5 Years
% Rank:
24
-39.16B
Peer Group Low
5.767B
Peer Group High
YTD
% Rank:
29
-7.441B
Peer Group Low
1.845B
Peer Group High
10 Years
% Rank:
33
-59.83B
Peer Group Low
10.34B
Peer Group High
Date Unavailable
Risk
Performance Versus Peer Group
Annual Total Returns Versus Peers
As of June 10, 2026.
Asset Allocation
As of March 31, 2026.
| Type | % Net |
|---|---|
| Cash | -4.82% |
| Stock | 62.51% |
| Bond | 31.44% |
| Convertible | 0.00% |
| Preferred | 0.25% |
| Other | 10.62% |
Top 10 Holdings
| Name | % Weight | Price | % Change |
|---|---|---|---|
| Voya US Stock Index Portfolio Institutional | 28.57% | 22.82 | -0.26% |
| Voya Intermediate Bond Fund R6 | 17.40% | 8.70 | 0.23% |
| VY T Rowe Price Capital Appreciation Port R6 | 9.96% | 27.75 | 0.33% |
| Voya Short Duration Bond Fd R6 | 7.97% | 9.30 | 0.11% |
| VY BrandywineGLOBAL - Bond Portfolio | 5.96% | 9.50 | 0.11% |
| Voya Multi-Manager International Equity Fund I | 5.54% | 12.68 | 0.16% |
| Voya Large Cap Value Fund R6 | 5.03% | 14.75 | 0.61% |
| Voya Russell Large Cap Growth Index Portfolio I | 3.96% | 74.70 | -0.85% |
| Voya Multi-Manager Mid Cap Value Fund I | 3.01% | 10.06 | 1.21% |
| Voya Large-Cap Growth Fund R6 | 2.99% | 65.20 | -0.81% |
Fees & Availability
| Fees | |
| Actual 12B-1 Fee | 0.50% |
| Actual Management Fee | 0.02% |
| Administration Fee | -- |
| Maximum Front Load | -- |
| Maximum Deferred Load | -- |
| Maximum Redemption Fee | -- |
| General Availability | |
| Available for Insurance Product |
|
| Available for RRSP | No |
| Purchase Details | |
| Open to New Investors |
|
| Minimum Initial Investment | 0.00 None |
| Minimum Subsequent Investment | 0.00 None |
Basic Info
| Investment Strategy | |
| The Fund seeks provide capital growth through a diversified asset allocation strategy. The Portfolio invests in a combination of Underlying Funds which are active U.S. stock, international stock, U.S. bond and other fixed-income investments using asset allocation strategies designed for investors saving for retirement. |
| General | |
| Security Type | Insurance Fund |
| Equity Style | -- |
| Broad Asset Class | Allocation |
| Broad Category | Allocation |
| Global Peer Group | Mixed Asset USD Aggressive |
| Peer Group | Mixed-Asset Target Alloc Growth Funds |
| Global Macro | Mixed Asset HC Aggressive |
| US Macro | Mixed-Assets Target Allocation Funds |
| YCharts Categorization | -- |
| YCharts Benchmark | -- |
| Prospectus Objective | Growth Funds |
| Fund Owner Firm Name | Voya |
| Broad Asset Class Benchmark Index | |
| ^SPXTR | 100.0% |
Fundamentals
| General | |
| Distribution Yield | -- |
| Dividend Yield TTM (6-8-26) | 1.84% |
| 30-Day SEC Yield | -- |
| 7-Day SEC Yield | -- |
| Number of Holdings | 16 |
| Stock | |
| Weighted Average PE Ratio | 30.17 |
| Weighted Average Price to Sales Ratio | 7.427 |
| Weighted Average Price to Book Ratio | 9.481 |
| Weighted Median ROE | 72.46% |
| Weighted Median ROA | 14.58% |
| ROI (TTM) | 20.68% |
| Return on Investment (TTM) | 20.68% |
| Earning Yield | 0.0415 |
| LT Debt / Shareholders Equity | 0.7119 |
| Number of Equity Holdings | 0 |
| Bond | |
| Yield to Maturity (3-31-26) | 4.84% |
| Effective Duration | -- |
| Average Coupon | 4.65% |
| Calculated Average Quality | 2.629 |
| Effective Maturity | 13.14 |
| Nominal Maturity | 13.48 |
| Number of Bond Holdings | 0 |
As of March 31, 2026
Growth Metrics
| EPS Growth (1Y) | 24.00% |
| EPS Growth (3Y) | 18.84% |
| EPS Growth (5Y) | 23.56% |
| Sales Growth (1Y) | 15.43% |
| Sales Growth (3Y) | 14.10% |
| Sales Growth (5Y) | 16.01% |
| Sales per Share Growth (1Y) | 33.32% |
| Sales per Share Growth (3Y) | 14.59% |
| Operating Cash Flow - Growth Rate (3Y) | 25.14% |
As of March 31, 2026
Fund Details
Top Portfolio Holders
| Name | % Weight |
|---|---|
| Portfolio A | 5.00% |
| Portfolio B | 3.50% |
| Portfolio C | 2.25% |