

Voya Solution Aggressive Portfolio Adv (IAVAX)
16.85
+0.06
(+0.36%)
USD |
May 22 2026
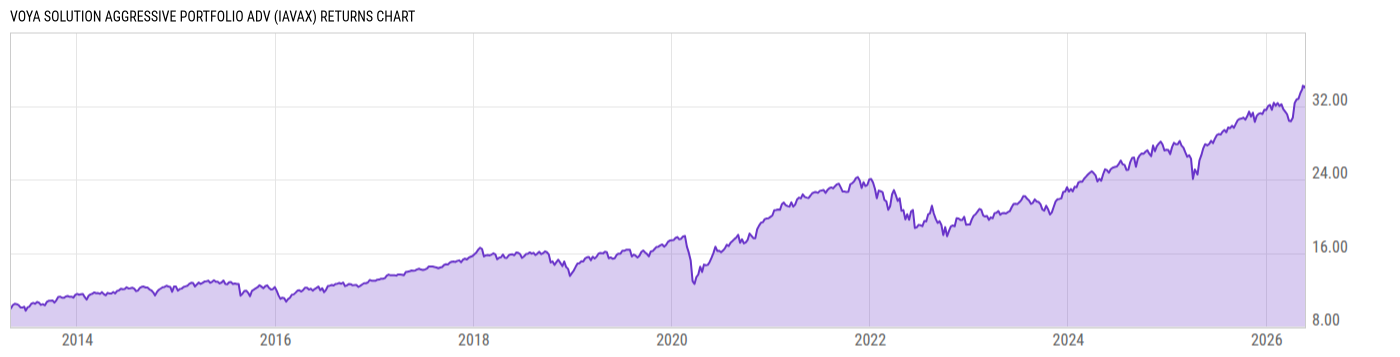
Returns Chart
Key Stats
| Net Expense Ratio | Total Assets Under Management | Weighted Average Dividend Yield | Turnover Ratio (Generic) |
|---|---|---|---|
| 1.27% | 227.56M | -- | 27.00% |
| 1 Year Fund Level Flows | 1 Year Total Returns (Daily) | Annualized Total Returns Since Inception (Daily) | Max Drawdown (Since Inception) |
| -8.033M | 24.80% |
Basic Info
| Investment Strategy | |
| The Fund seeks growth of capital. The Fund may invest up to 100% of its assets in a combination of Underlying Funds which provide exposure to a wide range of traditional asset classes which include stocks, bonds, and cash and non-traditional asset classes incuding real estate, commodities, and floating rate loans. |
| General | |
| Security Type | Insurance Fund |
| Equity Style | -- |
| Broad Asset Class | Allocation |
| Broad Category | Allocation |
| Global Peer Group | Mixed Asset USD Aggressive |
| Peer Group | Mixed-Asset Target Alloc Agg Gro Funds |
| Global Macro | Mixed Asset HC Aggressive |
| US Macro | Mixed-Assets Target Allocation Funds |
| YCharts Categorization | -- |
| YCharts Benchmark | -- |
| Prospectus Objective | Growth Funds |
| Fund Owner Firm Name | Voya |
| Broad Asset Class Benchmark Index | |
| ^SPXTR | 100.0% |
Net Fund Flows Versus Peer Group
1 Month
% Rank:
41
-46.59M
Peer Group Low
300.01M
Peer Group High
1 Year
% Rank:
33
-8.033M
-502.07M
Peer Group Low
690.68M
Peer Group High
3 Months
% Rank:
38
-137.67M
Peer Group Low
300.01M
Peer Group High
3 Years
% Rank:
35
-1.688B
Peer Group Low
858.19M
Peer Group High
6 Months
% Rank:
34
-281.84M
Peer Group Low
542.50M
Peer Group High
5 Years
% Rank:
35
-2.460B
Peer Group Low
1.040B
Peer Group High
YTD
% Rank:
38
-186.03M
Peer Group Low
300.01M
Peer Group High
10 Years
% Rank:
37
-4.493B
Peer Group Low
1.383B
Peer Group High
Date Unavailable
Risk
Performance Versus Peer Group
Annual Total Returns Versus Peers
As of May 24, 2026.
Asset Allocation
As of March 31, 2026.
| Type | % Net |
|---|---|
| Cash | 1.62% |
| Stock | 90.65% |
| Bond | 5.35% |
| Convertible | 0.00% |
| Preferred | 0.23% |
| Other | 2.14% |
Top 10 Holdings
| Name | % Weight | Price | % Change |
|---|---|---|---|
| Voya US Stock Index Portfolio Institutional | 37.73% | 23.08 | 0.39% |
| Voya Multi-Manager International Equity Fund I | 9.52% | 12.76 | 0.08% |
| VY T Rowe Price Capital Appreciation Port R6 | 7.47% | 28.01 | 0.11% |
| Voya Large Cap Value Fund R6 | 5.97% | 14.49 | 0.14% |
| Voya Multi-Manager Mid Cap Value Fund I | 5.93% | 9.86 | 0.72% |
| VY T Rowe Price Diversified Mid Cap Gr Port R6 | 5.75% | 11.33 | 1.07% |
| Voya Russell Large Cap Growth Index Portfolio I | 5.04% | 76.60 | 0.16% |
| Voya MI Dynamic Small Cap Fund R6 | 4.50% | 15.79 | 0.83% |
| Voya Large-Cap Growth Fund R6 | 4.02% | 66.40 | 0.05% |
| Voya Multi-Manager Emerging Markets Equity Fund I | 3.48% | 16.38 | -0.30% |
Fees & Availability
| Fees | |
| Actual 12B-1 Fee | 0.50% |
| Actual Management Fee | 0.04% |
| Administration Fee | -- |
| Maximum Front Load | -- |
| Maximum Deferred Load | -- |
| Maximum Redemption Fee | -- |
| General Availability | |
| Available for Insurance Product |
|
| Available for RRSP | No |
| Purchase Details | |
| Open to New Investors |
|
| Minimum Initial Investment | 0.00 None |
| Minimum Subsequent Investment | 0.00 None |
Basic Info
| Investment Strategy | |
| The Fund seeks growth of capital. The Fund may invest up to 100% of its assets in a combination of Underlying Funds which provide exposure to a wide range of traditional asset classes which include stocks, bonds, and cash and non-traditional asset classes incuding real estate, commodities, and floating rate loans. |
| General | |
| Security Type | Insurance Fund |
| Equity Style | -- |
| Broad Asset Class | Allocation |
| Broad Category | Allocation |
| Global Peer Group | Mixed Asset USD Aggressive |
| Peer Group | Mixed-Asset Target Alloc Agg Gro Funds |
| Global Macro | Mixed Asset HC Aggressive |
| US Macro | Mixed-Assets Target Allocation Funds |
| YCharts Categorization | -- |
| YCharts Benchmark | -- |
| Prospectus Objective | Growth Funds |
| Fund Owner Firm Name | Voya |
| Broad Asset Class Benchmark Index | |
| ^SPXTR | 100.0% |
Fundamentals
| General | |
| Distribution Yield | -- |
| Dividend Yield TTM (5-21-26) | 1.39% |
| 30-Day SEC Yield | -- |
| 7-Day SEC Yield | -- |
| Number of Holdings | 15 |
| Stock | |
| Weighted Average PE Ratio | 29.93 |
| Weighted Average Price to Sales Ratio | 7.082 |
| Weighted Average Price to Book Ratio | 9.031 |
| Weighted Median ROE | 66.81% |
| Weighted Median ROA | 13.32% |
| ROI (TTM) | 19.29% |
| Return on Investment (TTM) | 19.29% |
| Earning Yield | 0.0429 |
| LT Debt / Shareholders Equity | 0.7703 |
| Number of Equity Holdings | 0 |
| Bond | |
| Yield to Maturity (3-31-26) | 4.89% |
| Effective Duration | -- |
| Average Coupon | 4.53% |
| Calculated Average Quality | 3.159 |
| Effective Maturity | 10.62 |
| Nominal Maturity | 10.74 |
| Number of Bond Holdings | 0 |
As of March 31, 2026
Growth Metrics
| EPS Growth (1Y) | 23.69% |
| EPS Growth (3Y) | 17.82% |
| EPS Growth (5Y) | 22.41% |
| Sales Growth (1Y) | 14.96% |
| Sales Growth (3Y) | 13.60% |
| Sales Growth (5Y) | 15.64% |
| Sales per Share Growth (1Y) | 56.36% |
| Sales per Share Growth (3Y) | 13.80% |
| Operating Cash Flow - Growth Rate (3Y) | 24.68% |
As of March 31, 2026
Top Portfolio Holders
| Name | % Weight |
|---|---|
| Portfolio A | 5.00% |
| Portfolio B | 3.50% |
| Portfolio C | 2.25% |