

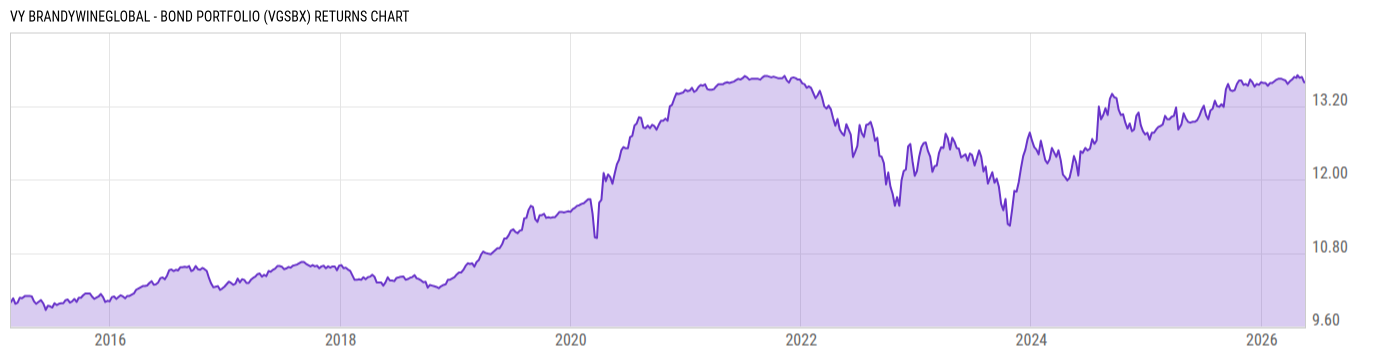
VY BrandywineGLOBAL - Bond Portfolio (VGSBX)
9.50
+0.01
(+0.11%)
USD |
Jun 09 2026
Returns Chart
Key Stats
| Net Expense Ratio | Total Assets Under Management | Weighted Average Dividend Yield | Turnover Ratio (Generic) |
|---|---|---|---|
| 0.55% | 221.99M | -- | 194.0% |
| 1 Year Fund Level Flows | 1 Year Total Returns (Daily) | Annualized Total Returns Since Inception (Daily) | Max Drawdown (Since Inception) |
| -21.98M | 5.55% |
Basic Info
| Investment Strategy | |
| The Fund seeks total return consisting of capital appreciation and income. The Fund invests at least 80% of its net assets in bonds and other fixed-income securities. It may also invest in derivative instruments that have the economic characteristics similar to bonds and other fixed-income securities. |
| General | |
| Security Type | Insurance Fund |
| Equity Style | -- |
| Broad Asset Class | Taxable Bond |
| Broad Category | Fixed Income |
| Global Peer Group | Bond USD |
| Peer Group | General Bond Funds |
| Global Macro | Bond HC |
| US Macro | General Domestic Taxable Fixed Income Funds |
| YCharts Categorization | -- |
| YCharts Benchmark | -- |
| Prospectus Objective | General Bond Funds |
| Fund Owner Firm Name | Voya |
| Broad Asset Class Benchmark Index | |
| ^BBUSATR | 100.0% |
Net Fund Flows Versus Peer Group
1 Month
% Rank:
92
-3.511B
Peer Group Low
3.098B
Peer Group High
1 Year
% Rank:
77
-21.98M
-647.01M
Peer Group Low
13.23B
Peer Group High
3 Months
% Rank:
82
-2.241B
Peer Group Low
3.962B
Peer Group High
3 Years
% Rank:
73
-12.70B
Peer Group Low
18.00B
Peer Group High
6 Months
% Rank:
81
-3.515B
Peer Group Low
5.649B
Peer Group High
5 Years
% Rank:
89
-1.461B
Peer Group Low
49.86B
Peer Group High
YTD
% Rank:
78
-2.086B
Peer Group Low
5.100B
Peer Group High
10 Years
% Rank:
85
-1.866B
Peer Group Low
81.23B
Peer Group High
Date Unavailable
Risk
Performance Versus Peer Group
Annual Total Returns Versus Peers
As of June 10, 2026.
Asset Allocation
As of April 30, 2026.
| Type | % Net |
|---|---|
| Cash | 0.19% |
| Stock | 0.00% |
| Bond | 99.81% |
| Convertible | 0.00% |
| Preferred | 0.00% |
| Other | 0.00% |
Top 10 Holdings
| Name | % Weight | Price | % Change |
|---|---|---|---|
| United States of America USGB 4.25 08/15/2035 FIX USD Government | 10.34% | 98.10 | 0.28% |
| United States of America USGB 01/31/2028 FLT USD Government | 8.13% | 100.18 | -0.06% |
| United States of America USGB 10/31/2027 FLT USD Government | 8.13% | 100.26 | -0.07% |
| United States of America USGB 2.375 02/15/2056 FIX USD Government | 4.77% | 92.23 | 0.68% |
| BlackRock Liquidity FedFund Institutional | 4.50% | 1.00 | 0.00% |
| United States of America USGB 4.75 05/15/2055 FIX USD Government | 4.15% | 95.88 | 0.56% |
| FEDERAL NATIONAL MORTGAGE ASSOCIATION FNMA-New 0.75 10/08/2027 FIX USD Agency | 4.13% | 95.63 | 0.04% |
| Federal Home Loan Banks FHLB 3.625 09/04/2026 FIX USD Agency | 3.90% | 99.94 | 0.00% |
| Federal Home Loan Banks FHLB 4.25 09/11/2026 FIX USD Agency | 3.49% | 100.09 | 0.00% |
|
Government National Mortgage Association 2 20-JAN-2056 MB0873
|
2.44% | -- | -- |
Fees & Availability
| Fees | |
| Actual 12B-1 Fee | -- |
| Actual Management Fee | 0.50% |
| Administration Fee | -- |
| Maximum Front Load | -- |
| Maximum Deferred Load | -- |
| Maximum Redemption Fee | -- |
| General Availability | |
| Available for Insurance Product |
|
| Available for RRSP | No |
| Purchase Details | |
| Open to New Investors |
|
| Minimum Initial Investment | 0.00 None |
| Minimum Subsequent Investment | 0.00 None |
Basic Info
| Investment Strategy | |
| The Fund seeks total return consisting of capital appreciation and income. The Fund invests at least 80% of its net assets in bonds and other fixed-income securities. It may also invest in derivative instruments that have the economic characteristics similar to bonds and other fixed-income securities. |
| General | |
| Security Type | Insurance Fund |
| Equity Style | -- |
| Broad Asset Class | Taxable Bond |
| Broad Category | Fixed Income |
| Global Peer Group | Bond USD |
| Peer Group | General Bond Funds |
| Global Macro | Bond HC |
| US Macro | General Domestic Taxable Fixed Income Funds |
| YCharts Categorization | -- |
| YCharts Benchmark | -- |
| Prospectus Objective | General Bond Funds |
| Fund Owner Firm Name | Voya |
| Broad Asset Class Benchmark Index | |
| ^BBUSATR | 100.0% |
Fundamentals
| General | |
| Distribution Yield | -- |
| Dividend Yield TTM (6-8-26) | 3.90% |
| 30-Day SEC Yield (5-31-26) | 4.76% |
| 7-Day SEC Yield (1-31-20) | 1.69% |
| Number of Holdings | 88 |
| Bond | |
| Yield to Maturity (4-30-26) | 4.18% |
| Effective Duration | -- |
| Average Coupon | 4.36% |
| Calculated Average Quality | 2.473 |
| Effective Maturity | 15.33 |
| Nominal Maturity | 16.65 |
| Number of Bond Holdings | 76 |
As of April 30, 2026
Fund Details
| Key Dates | |
| Launch Date | 2/20/2015 |
| Last Annual Report Date | 12/31/2025 |
| Last Prospectus Date | 5/1/2026 |
| Attributes | |
| Index Fund | -- |
| Inverse Fund | No |
| Leveraged Fund | -- |
| Fund of Funds | No |
| Currency Hedged Fund | -- |
| Socially Responsible Fund | No |
Top Portfolio Holders
| Name | % Weight |
|---|---|
| Portfolio A | 5.00% |
| Portfolio B | 3.50% |
| Portfolio C | 2.25% |