

Voya Index Solution 2050 Portfolio Adviser (IDXPX)
25.01
-0.01
(-0.04%)
USD |
Jun 09 2026
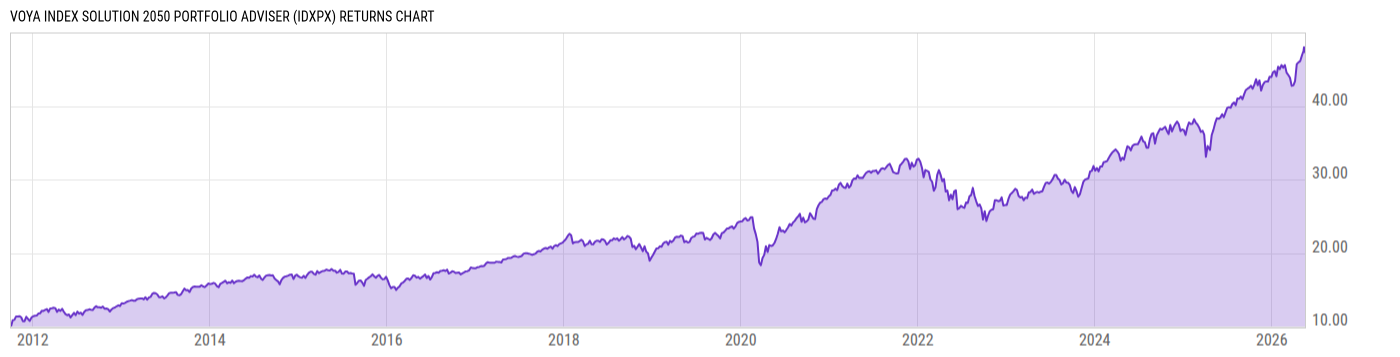
Returns Chart
Key Stats
| Net Expense Ratio | Total Assets Under Management | Weighted Average Dividend Yield | Turnover Ratio (Generic) |
|---|---|---|---|
| 0.76% | 1.064B | -- | 26.00% |
| 1 Year Fund Level Flows | 1 Year Total Returns (Daily) | Annualized Total Returns Since Inception (Daily) | Max Drawdown (Since Inception) |
| -50.66M | 22.58% |
Basic Info
| Investment Strategy | |
| The Fund seeks to provide total return consistent with an asset allocation targeted at retirement in approximately 2050. The Fund invests in US stocks, international stocks, US bonds and other fixed-income investments. The Fund uses asset allocation strategies for investors expecting to retire around the year 2050. |
| General | |
| Security Type | Insurance Fund |
| Equity Style | -- |
| Broad Asset Class | Allocation |
| Broad Category | Allocation |
| Global Peer Group | Target Maturity MA USD 2050 |
| Peer Group | Mixed-Asset Target 2050 Funds |
| Global Macro | Target Maturity |
| US Macro | Mixed-Assets Target Date Funds |
| YCharts Categorization | -- |
| YCharts Benchmark | -- |
| Prospectus Objective | Growth Funds |
| Fund Owner Firm Name | Voya |
| Broad Asset Class Benchmark Index | |
| ^SPXTR | 100.0% |
Net Fund Flows Versus Peer Group
1 Month
% Rank:
64
-371.63M
Peer Group Low
357.98M
Peer Group High
1 Year
% Rank:
63
-50.66M
-1.962B
Peer Group Low
3.057B
Peer Group High
3 Months
% Rank:
61
-1.084B
Peer Group Low
1.183B
Peer Group High
3 Years
% Rank:
67
-2.544B
Peer Group Low
10.11B
Peer Group High
6 Months
% Rank:
63
-1.245B
Peer Group Low
1.980B
Peer Group High
5 Years
% Rank:
37
-3.959B
Peer Group Low
11.92B
Peer Group High
YTD
% Rank:
64
-909.04M
Peer Group Low
1.901B
Peer Group High
10 Years
% Rank:
26
-7.437B
Peer Group Low
17.37B
Peer Group High
Date Unavailable
Risk
Performance Versus Peer Group
Annual Total Returns Versus Peers
As of June 10, 2026.
Asset Allocation
As of March 31, 2026.
| Type | % Net |
|---|---|
| Cash | -1.26% |
| Stock | 92.19% |
| Bond | 6.14% |
| Convertible | 0.00% |
| Preferred | 0.24% |
| Other | 2.68% |
Top 10 Holdings
| Name | % Weight | Price | % Change |
|---|---|---|---|
| Voya VACS Index Series S Portfolio | 52.91% | 17.66 | -0.28% |
| Voya VACS Index Series I Portfolio | 26.66% | 14.57 | 0.00% |
| Voya VACS Index Series EM Portfolio | 7.93% | 17.31 | 0.87% |
| Voya VACS Index Series MC Portfolio | 4.00% | 13.46 | 0.67% |
| Voya VACS Index Series SC Portfolio | 2.99% | 12.55 | 0.40% |
| WisdomTree Voya Yield Enhanced USD Unvrsl Bd Fund | 2.97% | 48.24 | 0.18% |
|
5YR T NOTE JUN26
|
2.47% | -- | -- |
| Voya VP US Bond Index Portfolio I | 0.99% | 9.01 | 0.22% |
| Vanguard Long-Term Treasury Index Fund ETF | 0.99% | 54.39 | 0.50% |
| Voya Russell Large Cap Growth Index Portfolio I | 0.49% | 74.70 | -0.85% |
Fees & Availability
| Fees | |
| Actual 12B-1 Fee | 0.50% |
| Actual Management Fee | -- |
| Administration Fee | -- |
| Maximum Front Load | -- |
| Maximum Deferred Load | -- |
| Maximum Redemption Fee | -- |
| General Availability | |
| Available for Insurance Product |
|
| Available for RRSP | No |
| Purchase Details | |
| Open to New Investors |
|
| Minimum Initial Investment | 0.00 None |
| Minimum Subsequent Investment | 0.00 None |
Basic Info
| Investment Strategy | |
| The Fund seeks to provide total return consistent with an asset allocation targeted at retirement in approximately 2050. The Fund invests in US stocks, international stocks, US bonds and other fixed-income investments. The Fund uses asset allocation strategies for investors expecting to retire around the year 2050. |
| General | |
| Security Type | Insurance Fund |
| Equity Style | -- |
| Broad Asset Class | Allocation |
| Broad Category | Allocation |
| Global Peer Group | Target Maturity MA USD 2050 |
| Peer Group | Mixed-Asset Target 2050 Funds |
| Global Macro | Target Maturity |
| US Macro | Mixed-Assets Target Date Funds |
| YCharts Categorization | -- |
| YCharts Benchmark | -- |
| Prospectus Objective | Growth Funds |
| Fund Owner Firm Name | Voya |
| Broad Asset Class Benchmark Index | |
| ^SPXTR | 100.0% |
Fundamentals
| General | |
| Distribution Yield | -- |
| Dividend Yield TTM (6-8-26) | 1.19% |
| 30-Day SEC Yield | -- |
| 7-Day SEC Yield | -- |
| Number of Holdings | 14 |
| Stock | |
| Weighted Average PE Ratio | 27.93 |
| Weighted Average Price to Sales Ratio | 6.224 |
| Weighted Average Price to Book Ratio | 8.113 |
| Weighted Median ROE | 71.65% |
| Weighted Median ROA | 12.79% |
| ROI (TTM) | 19.11% |
| Return on Investment (TTM) | 19.11% |
| Earning Yield | 0.0474 |
| LT Debt / Shareholders Equity | 0.7383 |
| Number of Equity Holdings | 0 |
| Bond | |
| Yield to Maturity (3-31-26) | 4.80% |
| Effective Duration | -- |
| Average Coupon | 3.99% |
| Calculated Average Quality | 2.552 |
| Effective Maturity | 13.94 |
| Nominal Maturity | 14.11 |
| Number of Bond Holdings | 0 |
As of March 31, 2026
Growth Metrics
| EPS Growth (1Y) | 22.10% |
| EPS Growth (3Y) | 16.48% |
| EPS Growth (5Y) | 22.18% |
| Sales Growth (1Y) | 12.46% |
| Sales Growth (3Y) | 12.13% |
| Sales Growth (5Y) | 13.69% |
| Sales per Share Growth (1Y) | 26.34% |
| Sales per Share Growth (3Y) | 12.79% |
| Operating Cash Flow - Growth Rate (3Y) | 20.96% |
As of March 31, 2026
Top Portfolio Holders
| Name | % Weight |
|---|---|
| Portfolio A | 5.00% |
| Portfolio B | 3.50% |
| Portfolio C | 2.25% |