

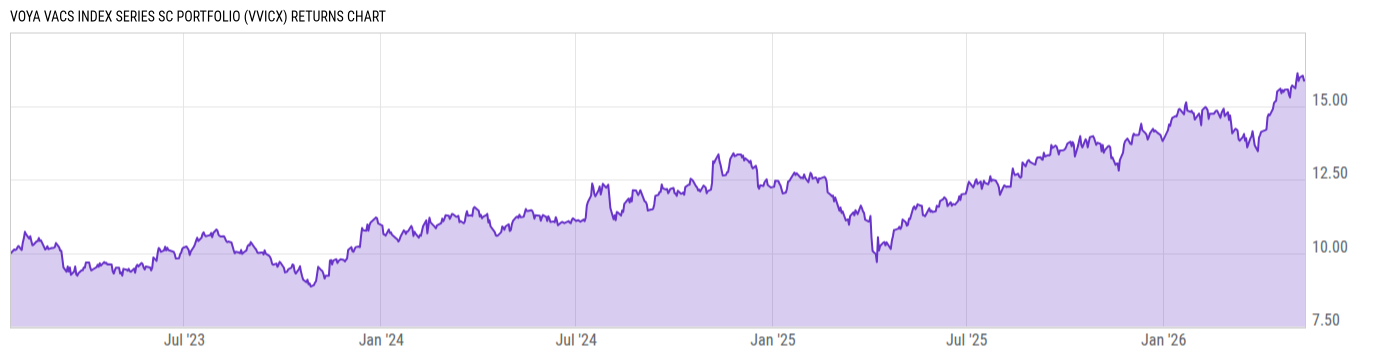
Voya VACS Index Series SC Portfolio (VVICX)
12.83
+0.12
(+0.94%)
USD |
Jun 02 2026
Returns Chart
Key Stats
| Net Expense Ratio | Total Assets Under Management | Weighted Average Dividend Yield | Turnover Ratio (Generic) |
|---|---|---|---|
| 0.16% | 208.71M | 1.06% | 18.00% |
| 1 Year Fund Level Flows | 1 Year Total Returns (Daily) | Annualized Total Returns Since Inception (Daily) | Max Drawdown (Since Inception) |
| -33.36M | 43.53% |
Basic Info
| Investment Strategy | |
| The Fund seeks investment results that correspond to the total of the Russell 2000 Index. The Portfolio invests in equity securities of companies included in the Index, convertible securities, other derivatives whose economic returns are by design equivalent to the returns of the Index and ETFs that track the index. |
| General | |
| Security Type | Insurance Fund |
| Equity Style | Small Cap Core |
| Broad Asset Class | US Equity |
| Broad Category | Equity |
| Global Peer Group | Equity US Sm&Mid Cap |
| Peer Group | Small-Cap Core Funds |
| Global Macro | Equity North America |
| US Macro | Small-Cap Funds |
| YCharts Categorization | -- |
| YCharts Benchmark | -- |
| Prospectus Objective | Small-Cap Funds |
| Fund Owner Firm Name | Voya |
| Broad Asset Class Benchmark Index | |
| ^SPXTR | 100.0% |
Net Fund Flows Versus Peer Group
1 Month
% Rank:
41
-1.408B
Peer Group Low
769.95M
Peer Group High
1 Year
% Rank:
49
-33.36M
-7.194B
Peer Group Low
2.189B
Peer Group High
3 Months
% Rank:
59
-1.388B
Peer Group Low
1.035B
Peer Group High
3 Years
% Rank:
72
-4.427B
Peer Group Low
6.142B
Peer Group High
6 Months
% Rank:
57
-3.555B
Peer Group Low
1.954B
Peer Group High
5 Years
% Rank:
18
-8.360B
Peer Group Low
7.929B
Peer Group High
YTD
% Rank:
64
-5.360B
Peer Group Low
1.730B
Peer Group High
10 Years
% Rank:
23
-10.79B
Peer Group Low
29.63B
Peer Group High
Date Unavailable
Risk
Performance Versus Peer Group
Annual Total Returns Versus Peers
As of June 03, 2026.
Asset Allocation
As of April 30, 2026.
| Type | % Net |
|---|---|
| Cash | -1.28% |
| Stock | 96.79% |
| Bond | 1.24% |
| Convertible | 0.00% |
| Preferred | 0.00% |
| Other | 3.24% |
Top 10 Holdings
| Name | % Weight | Price | % Change |
|---|---|---|---|
|
1RTY JUN26
|
3.24% | -- | -- |
| Morgan Stanley Inst Liq Govt Port Institutional | 2.82% | 1.00 | 0.00% |
| Bloom Energy Corp. | 1.83% | 302.85 | 10.73% |
| Credo Technology Group Holding Ltd. | 0.83% | 229.00 | 1.28% |
| Fabrinet | 0.73% | 701.11 | 12.65% |
| Coeur Mining, Inc. | 0.54% | 19.19 | -0.67% |
| Nextpower, Inc. | 0.51% | 152.22 | 4.96% |
| EchoStar Corp. | 0.49% | 123.55 | -3.04% |
| TTM Technologies, Inc. | 0.48% | 179.62 | 4.16% |
| IonQ, Inc. | 0.46% | 71.40 | 3.06% |
Fees & Availability
| Fees | |
| Actual 12B-1 Fee | -- |
| Actual Management Fee | -- |
| Administration Fee | -- |
| Maximum Front Load | -- |
| Maximum Deferred Load | -- |
| Maximum Redemption Fee | -- |
| General Availability | |
| Available for Insurance Product |
|
| Available for RRSP | No |
| Purchase Details | |
| Open to New Investors |
|
| Minimum Initial Investment | 0.00 None |
| Minimum Subsequent Investment | 0.00 None |
Basic Info
| Investment Strategy | |
| The Fund seeks investment results that correspond to the total of the Russell 2000 Index. The Portfolio invests in equity securities of companies included in the Index, convertible securities, other derivatives whose economic returns are by design equivalent to the returns of the Index and ETFs that track the index. |
| General | |
| Security Type | Insurance Fund |
| Equity Style | Small Cap Core |
| Broad Asset Class | US Equity |
| Broad Category | Equity |
| Global Peer Group | Equity US Sm&Mid Cap |
| Peer Group | Small-Cap Core Funds |
| Global Macro | Equity North America |
| US Macro | Small-Cap Funds |
| YCharts Categorization | -- |
| YCharts Benchmark | -- |
| Prospectus Objective | Small-Cap Funds |
| Fund Owner Firm Name | Voya |
| Broad Asset Class Benchmark Index | |
| ^SPXTR | 100.0% |
Fundamentals
| General | |
| Distribution Yield | -- |
| Dividend Yield TTM (6-1-26) | 1.32% |
| 30-Day SEC Yield | -- |
| 7-Day SEC Yield | -- |
| Number of Holdings | 1671 |
| Stock | |
| Weighted Average PE Ratio | 30.08 |
| Weighted Average Price to Sales Ratio | 8.163 |
| Weighted Average Price to Book Ratio | 5.710 |
| Weighted Median ROE | -3.84% |
| Weighted Median ROA | -1.26% |
| ROI (TTM) | 1.02% |
| Return on Investment (TTM) | 1.02% |
| Earning Yield | 0.0512 |
| LT Debt / Shareholders Equity | 1.417 |
| Number of Equity Holdings | 1664 |
As of April 30, 2026
Growth Metrics
| EPS Growth (1Y) | 18.19% |
| EPS Growth (3Y) | 9.46% |
| EPS Growth (5Y) | 14.83% |
| Sales Growth (1Y) | 18.57% |
| Sales Growth (3Y) | 13.89% |
| Sales Growth (5Y) | 15.82% |
| Sales per Share Growth (1Y) | 247.0% |
| Sales per Share Growth (3Y) | 11.00% |
| Operating Cash Flow - Growth Rate (3Y) | 29.54% |
As of April 30, 2026
Fund Details
| Key Dates | |
| Launch Date | 1/20/2023 |
| Last Annual Report Date | 12/31/2025 |
| Last Prospectus Date | -- |
| Attributes | |
| Index Fund |
|
| Inverse Fund | No |
| Leveraged Fund | -- |
| Fund of Funds | No |
| Currency Hedged Fund | -- |
| Socially Responsible Fund | No |
Top Portfolio Holders
| Name | % Weight |
|---|---|
| Portfolio A | 5.00% |
| Portfolio B | 3.50% |
| Portfolio C | 2.25% |