

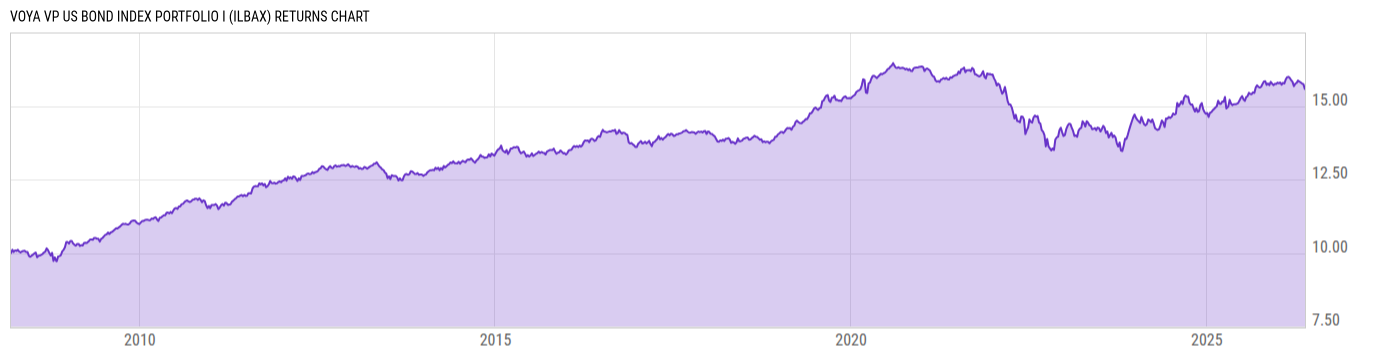
Voya VP US Bond Index Portfolio I (ILBAX)
9.01
+0.02
(+0.22%)
USD |
Jun 09 2026
Returns Chart
Key Stats
| Net Expense Ratio | Total Assets Under Management | Weighted Average Dividend Yield | Turnover Ratio (Generic) |
|---|---|---|---|
| 0.36% | 542.54M | -- | 420.0% |
| 1 Year Fund Level Flows | 1 Year Total Returns (Daily) | Annualized Total Returns Since Inception (Daily) | Max Drawdown (Since Inception) |
| -998.12M | 4.45% |
Basic Info
| Investment Strategy | |
| The Portfolio seeks investment results (before fees and expenses) that correspond to the total return of the Barclays Capital U.S. Aggregate Bond Index ("Index"). The Portfolio's investment objective is not fundamental and may be changed without a shareholder vote. |
| General | |
| Security Type | Insurance Fund |
| Equity Style | -- |
| Broad Asset Class | Taxable Bond |
| Broad Category | Fixed Income |
| Global Peer Group | Bond USD Medium Term |
| Peer Group | Core Bond Funds |
| Global Macro | Bond HC |
| US Macro | Short/Intermediate Investment-Grade Funds |
| YCharts Categorization | -- |
| YCharts Benchmark | -- |
| Prospectus Objective | Core Bond Funds |
| Fund Owner Firm Name | Voya |
| Broad Asset Class Benchmark Index | |
| ^BBUSATR | 100.0% |
Net Fund Flows Versus Peer Group
1 Month
% Rank:
78
-1.041B
Peer Group Low
10.20B
Peer Group High
1 Year
% Rank:
96
-998.12M
-5.263B
Peer Group Low
60.69B
Peer Group High
3 Months
% Rank:
22
-2.855B
Peer Group Low
12.30B
Peer Group High
3 Years
% Rank:
94
-14.12B
Peer Group Low
100.30B
Peer Group High
6 Months
% Rank:
33
-5.233B
Peer Group Low
34.54B
Peer Group High
5 Years
% Rank:
91
-16.57B
Peer Group Low
124.48B
Peer Group High
YTD
% Rank:
32
-5.213B
Peer Group Low
30.75B
Peer Group High
10 Years
% Rank:
94
-15.49B
Peer Group Low
254.64B
Peer Group High
Date Unavailable
Risk
Performance Versus Peer Group
Annual Total Returns Versus Peers
As of June 09, 2026.
Asset Allocation
As of April 30, 2026.
| Type | % Net |
|---|---|
| Cash | -8.33% |
| Stock | 0.00% |
| Bond | 95.05% |
| Convertible | 0.00% |
| Preferred | 0.00% |
| Other | 13.28% |
Top 10 Holdings
| Name | % Weight | Price | % Change |
|---|---|---|---|
| United States of America USGB 3.875 04/15/2029 FIX USD Government | 6.87% | 99.19 | 0.09% |
|
5YR T NOTE JUN26
|
6.84% | -- | -- |
|
2YR T-NOTE JUN26
|
6.79% | -- | -- |
| FEDERAL NATIONAL MORTGAGE ASSOCIATION FNMA-New 05/01/2026 FIX USD Agency (Matured) | 5.62% | 99.99 | 0.01% |
|
United States of America (Government) 3.75% 30-APR-2028
|
4.17% | -- | -- |
| United States of America USGB 4.125 02/15/2036 FIX USD Government | 4.15% | 96.91 | 0.30% |
|
United States of America (Government) 3.875% 30-APR-2031
|
3.64% | -- | -- |
| United States of America USGB 4.25 03/31/2033 FIX USD Government | 3.01% | 99.29 | 0.20% |
|
United States of America (Government) 4.125% 30-APR-2033
|
2.89% | -- | -- |
| United States of America USGB 3.0 08/15/2052 FIX USD Government | 2.63% | 70.03 | 0.60% |
Fees & Availability
| Fees | |
| Actual 12B-1 Fee | -- |
| Actual Management Fee | 0.24% |
| Administration Fee | -- |
| Maximum Front Load | -- |
| Maximum Deferred Load | -- |
| Maximum Redemption Fee | -- |
| General Availability | |
| Available for Insurance Product |
|
| Available for RRSP | No |
| Purchase Details | |
| Open to New Investors |
|
| Minimum Initial Investment | 0.00 None |
| Minimum Subsequent Investment | 0.00 None |
Basic Info
| Investment Strategy | |
| The Portfolio seeks investment results (before fees and expenses) that correspond to the total return of the Barclays Capital U.S. Aggregate Bond Index ("Index"). The Portfolio's investment objective is not fundamental and may be changed without a shareholder vote. |
| General | |
| Security Type | Insurance Fund |
| Equity Style | -- |
| Broad Asset Class | Taxable Bond |
| Broad Category | Fixed Income |
| Global Peer Group | Bond USD Medium Term |
| Peer Group | Core Bond Funds |
| Global Macro | Bond HC |
| US Macro | Short/Intermediate Investment-Grade Funds |
| YCharts Categorization | -- |
| YCharts Benchmark | -- |
| Prospectus Objective | Core Bond Funds |
| Fund Owner Firm Name | Voya |
| Broad Asset Class Benchmark Index | |
| ^BBUSATR | 100.0% |
Fundamentals
| General | |
| Distribution Yield | -- |
| Dividend Yield TTM (6-8-26) | 3.99% |
| 30-Day SEC Yield (5-31-26) | 4.00% |
| 7-Day SEC Yield (1-31-20) | 2.02% |
| Number of Holdings | 4557 |
| Bond | |
| Yield to Maturity (4-30-26) | 4.54% |
| Effective Duration | -- |
| Average Coupon | 4.09% |
| Calculated Average Quality | 2.394 |
| Effective Maturity | 12.46 |
| Nominal Maturity | 12.55 |
| Number of Bond Holdings | 4539 |
As of April 30, 2026
Fund Details
Top Portfolio Holders
| Name | % Weight |
|---|---|
| Portfolio A | 5.00% |
| Portfolio B | 3.50% |
| Portfolio C | 2.25% |