

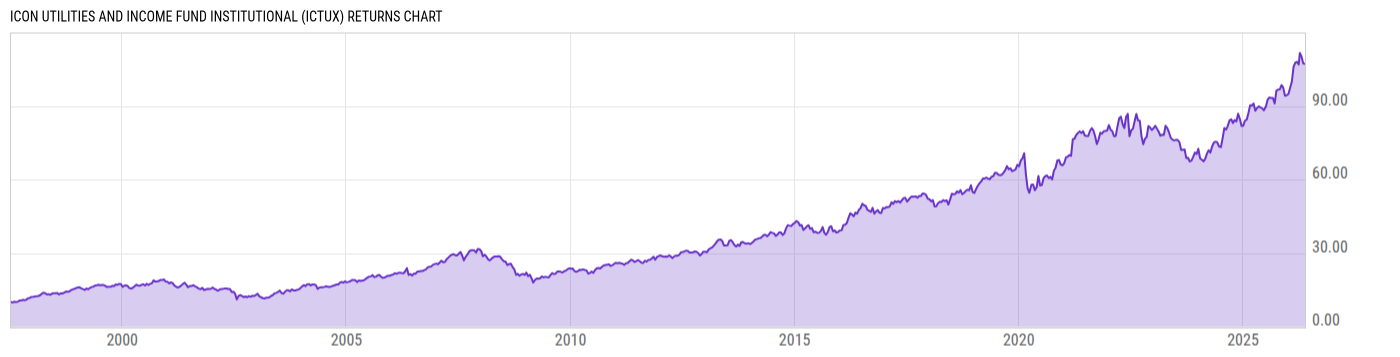
ICON Utilities and Income Fund Institutional (ICTUX)
11.64
+0.03
(+0.26%)
USD |
Jun 10 2026
Returns Chart
Key Stats
| Net Expense Ratio | Total Assets Under Management | Weighted Average Dividend Yield | Turnover Ratio (Generic) |
|---|---|---|---|
| 1.66% | 22.91M | 2.92% | 19.00% |
| 1 Year Fund Level Flows | 1 Year Total Returns (Daily) | Annualized Total Returns Since Inception (Daily) | Max Drawdown (Since Inception) |
| -3.678M | 16.22% |
Basic Info
| Investment Strategy | |
| The Fund seeks to provide long-term capital appreciation by investing primarily in equity securities, including common stock and securities convertible into common stock of U.S. issuers. |
| General | |
| Security Type | Mutual Fund |
| Equity Style | Mid Cap Value |
| Broad Asset Class | Sector Equity |
| Broad Category | Equity |
| Global Peer Group | Equity Sector Utilities |
| Peer Group | Utility Funds |
| Global Macro | Equity Industry Sector |
| US Macro | Sector Equity Funds |
| YCharts Categorization | -- |
| YCharts Benchmark | -- |
| Prospectus Objective | Utility Funds |
| Fund Owner Firm Name | ICON |
| Broad Asset Class Benchmark Index | |
| ^MSWNTR | 100.0% |
Net Fund Flows Versus Peer Group
1 Month
% Rank:
33
-519.71M
Peer Group Low
89.43M
Peer Group High
1 Year
% Rank:
42
-3.678M
-1.062B
Peer Group Low
1.346B
Peer Group High
3 Months
% Rank:
46
-494.85M
Peer Group Low
246.48M
Peer Group High
3 Years
% Rank:
49
-1.557B
Peer Group Low
1.314B
Peer Group High
6 Months
% Rank:
35
-1.009B
Peer Group Low
450.28M
Peer Group High
5 Years
% Rank:
45
-2.034B
Peer Group Low
3.786B
Peer Group High
YTD
% Rank:
35
-1.061B
Peer Group Low
351.61M
Peer Group High
10 Years
% Rank:
42
-4.573B
Peer Group Low
3.712B
Peer Group High
Date Unavailable
Risk
Performance Versus Peer Group
Annual Total Returns Versus Peers
As of June 11, 2026.
Asset Allocation
As of March 31, 2026.
| Type | % Net |
|---|---|
| Cash | 0.63% |
| Stock | 96.84% |
| Bond | 0.00% |
| Convertible | 0.00% |
| Preferred | 0.00% |
| Other | 2.54% |
Top 10 Holdings
| Name | % Weight | Price | % Change |
|---|---|---|---|
| American Electric Power Co., Inc. | 6.27% | 129.68 | 0.89% |
| Atmos Energy Corp. | 5.78% | 170.31 | 0.61% |
| Vodafone Group Plc | 5.66% | 15.18 | 0.90% |
| Ameren Corp. | 5.56% | 109.95 | 1.08% |
| NextEra Energy, Inc. | 5.35% | 85.38 | 0.31% |
| Consolidated Edison, Inc. | 5.26% | 108.97 | 1.27% |
| DTE Energy Co. | 5.24% | 147.58 | 1.03% |
| Xcel Energy, Inc. | 5.12% | 78.62 | 0.67% |
| National Fuel Gas Co. | 5.11% | 78.47 | 1.74% |
| Evergy, Inc. | 5.11% | 83.93 | 1.33% |
Fees & Availability
| Fees | |
| Actual 12B-1 Fee | -- |
| Actual Management Fee | 1.00% |
| Administration Fee | 17.79K% |
| Maximum Front Load | -- |
| Maximum Deferred Load | -- |
| Maximum Redemption Fee | -- |
| General Availability | |
| Available for Insurance Product | No |
| Available for RRSP | No |
| Purchase Details | |
| Open to New Investors |
|
| Minimum Initial Investment | 1000.00 None |
| Minimum Subsequent Investment | 100.00 None |
Basic Info
| Investment Strategy | |
| The Fund seeks to provide long-term capital appreciation by investing primarily in equity securities, including common stock and securities convertible into common stock of U.S. issuers. |
| General | |
| Security Type | Mutual Fund |
| Equity Style | Mid Cap Value |
| Broad Asset Class | Sector Equity |
| Broad Category | Equity |
| Global Peer Group | Equity Sector Utilities |
| Peer Group | Utility Funds |
| Global Macro | Equity Industry Sector |
| US Macro | Sector Equity Funds |
| YCharts Categorization | -- |
| YCharts Benchmark | -- |
| Prospectus Objective | Utility Funds |
| Fund Owner Firm Name | ICON |
| Broad Asset Class Benchmark Index | |
| ^MSWNTR | 100.0% |
Fundamentals
| General | |
| Distribution Yield | -- |
| Dividend Yield TTM (6-10-26) | 1.70% |
| 30-Day SEC Yield (5-31-26) | 1.46% |
| 7-Day SEC Yield | -- |
| Number of Holdings | 23 |
| Stock | |
| Weighted Average PE Ratio | 20.50 |
| Weighted Average Price to Sales Ratio | 2.981 |
| Weighted Average Price to Book Ratio | 2.298 |
| Weighted Median ROE | 10.72% |
| Weighted Median ROA | 3.15% |
| ROI (TTM) | 3.52% |
| Return on Investment (TTM) | 3.52% |
| Earning Yield | 0.0513 |
| LT Debt / Shareholders Equity | 1.389 |
| Number of Equity Holdings | 20 |
As of March 31, 2026
Growth Metrics
| EPS Growth (1Y) | 15.44% |
| EPS Growth (3Y) | 16.97% |
| EPS Growth (5Y) | 8.26% |
| Sales Growth (1Y) | 10.82% |
| Sales Growth (3Y) | 1.54% |
| Sales Growth (5Y) | 6.57% |
| Sales per Share Growth (1Y) | 9.27% |
| Sales per Share Growth (3Y) | 0.21% |
| Operating Cash Flow - Growth Rate (3Y) | 15.84% |
As of March 31, 2026
Fund Details
| Key Dates | |
| Inception Date | 7/9/1997 |
| Last Annual Report Date | 12/31/2025 |
| Last Prospectus Date | 5/1/2026 |
| Share Classes | |
| ICTVX | Inv |
| Attributes | |
| Index Fund | -- |
| Inverse Fund | No |
| Leveraged Fund | -- |
| Fund of Funds | No |
| Currency Hedged Fund | -- |
| Socially Responsible Fund | No |
Top Portfolio Holders
| Name | % Weight |
|---|---|
| Portfolio A | 5.00% |
| Portfolio B | 3.50% |
| Portfolio C | 2.25% |
Excel Add-In Codes
| Name: =YCI("M:ICTUX", "name") |
| Broad Asset Class: =YCI("M:ICTUX", "broad_asset_class") |
| Broad Category: =YCI("M:ICTUX", "broad_category_group") |
| Prospectus Objective: =YCI("M:ICTUX", "prospectus_objective") |
| To find the codes for any of our securities and financial metrics, see our Complete Excel Reference. |