

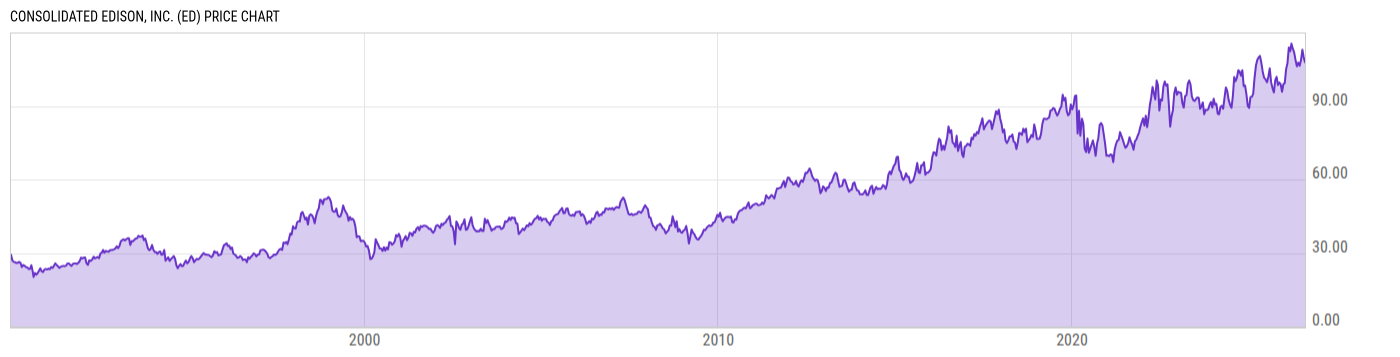
Consolidated Edison, Inc. (ED)
107.89
-0.96
(-0.88%)
USD |
NYSE |
Aug 03, 13:42
Price Chart
Key Stats
| Price and Performance | |
|---|---|
| Market Cap | 36.04B |
| 52 Week High (Daily) | |
| 52 Week Low (Daily) | |
| All-Time High (Daily) | |
| Year to Date Total Returns (Daily) | |
| 1 Month Total Returns (Daily) | |
| 1 Year Total Returns (Daily) | 8.68% |
| Valuation | |
| PE Ratio | 18.17 |
| PE Ratio (Forward) | |
| PS Ratio | 2.272 |
| Price to Book Value | 1.408 |
| EV to EBITDA | |
| Dividend | |
|---|---|
| Dividend | 0.8875 |
| Dividend Yield (Forward) | |
| Financials | |
| Revenue (5 Year Growth) | |
| Revenue (Quarterly YoY Growth) | |
| EPS Diluted (5 Year Growth) | |
| EPS Diluted (Quarterly YoY Growth) | |
| Debt to Equity Ratio | 1.062 |
| Return on Equity | |
| Return on Assets | |
| Risk | |
| Beta (5Y) | |
| Max Drawdown (5Y) | 22.03% |
Profile
| Consolidated Edison, Inc. is a holding company, which engages in the business of regulated electric, gas, and steam delivery. It operates through the following segments: Consolidated Edison Company of New York (CECONY), Orange and Rockland Utilities(O&R), and Con Edison Transmission. The CECONY segment is involved in the regulated electric, gas, and steam utility businesses. The O&R segment covers regulated electric and gas utility delivery businesses. The Con Edison Transmission segment invests in electric and gas transmission projects. The company was founded in 1823 and is headquartered in New York, NY. |
| URL | http://www.conedison.com |
| Investor Relations URL | https://investor.conedison.com/ |
| HQ State/Province | New York |
| Sector | Utilities |
| Industry | Multi-Utilities |
| Equity Style | Mid Cap Value |
| Next Earnings Release | Aug. 06, 2026 |
| Last Earnings Release | May. 07, 2026 |
| Next Ex-Dividend Date | Aug. 19, 2026 |
| Last Ex-Dividend Date | May. 13, 2026 |