

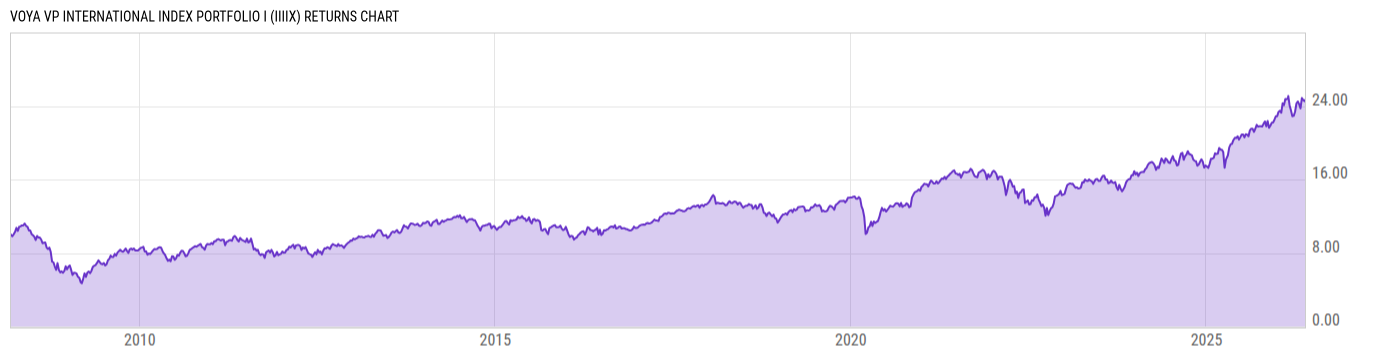
Voya VP International Index Portfolio I (IIIIX)
14.73
-0.01
(-0.07%)
USD |
May 22 2026
Returns Chart
Key Stats
| Net Expense Ratio | Total Assets Under Management | Weighted Average Dividend Yield | Turnover Ratio (Generic) |
|---|---|---|---|
| 0.46% | 690.13M | 2.64% | 4.00% |
| 1 Year Fund Level Flows | 1 Year Total Returns (Daily) | Annualized Total Returns Since Inception (Daily) | Max Drawdown (Since Inception) |
| -773.72M | 21.76% |
Basic Info
| Investment Strategy | |
| The Portfolio seeks results that correspond to the total return of the Morgan Stanley Capital International Europe, Australia and Far East Index which is a market value-weighted index that reflects the performance of approximately 1,100 securities listed on the stock exchanges of Europe, Australasia and the Far East. |
| General | |
| Security Type | Insurance Fund |
| Equity Style | Large Cap Core |
| Broad Asset Class | International Equity |
| Broad Category | Equity |
| Global Peer Group | Equity Global ex US |
| Peer Group | International Large-Cap Core |
| Global Macro | Equity Global |
| US Macro | Developed International Markets Funds |
| YCharts Categorization | -- |
| YCharts Benchmark | -- |
| Prospectus Objective | International Funds |
| Fund Owner Firm Name | Voya |
| Broad Asset Class Benchmark Index | |
| ^MSACXUSNTR | 100.0% |
Net Fund Flows Versus Peer Group
1 Month
% Rank:
57
-491.99M
Peer Group Low
2.961B
Peer Group High
1 Year
% Rank:
86
-773.72M
-3.694B
Peer Group Low
8.785B
Peer Group High
3 Months
% Rank:
52
-1.417B
Peer Group Low
3.131B
Peer Group High
3 Years
% Rank:
86
-8.651B
Peer Group Low
13.83B
Peer Group High
6 Months
% Rank:
38
-3.655B
Peer Group Low
5.990B
Peer Group High
5 Years
% Rank:
80
-11.14B
Peer Group Low
20.98B
Peer Group High
YTD
% Rank:
47
-2.382B
Peer Group Low
4.598B
Peer Group High
10 Years
% Rank:
82
-34.06B
Peer Group Low
36.47B
Peer Group High
Date Unavailable
Risk
Performance Versus Peer Group
Annual Total Returns Versus Peers
As of May 23, 2026.
Asset Allocation
As of March 31, 2026.
| Type | % Net |
|---|---|
| Cash | -2.26% |
| Stock | 96.63% |
| Bond | 0.69% |
| Convertible | 0.00% |
| Preferred | 0.26% |
| Other | 4.68% |
Top 10 Holdings
| Name | % Weight | Price | % Change |
|---|---|---|---|
|
MSCI EAFE JUN6
|
4.67% | -- | -- |
| ASML Holding NV | 2.53% | 1645.20 | 3.67% |
| Morgan Stanley Inst Liq Govt Port Institutional | 1.87% | 1.00 | 0.00% |
|
ICICI PRU FM SR 81 1116 D DIR CUM CF
|
1.42% | -- | -- |
| AstraZeneca PLC | 1.32% | 187.03 | -1.43% |
| Roche Holding AG | 1.29% | 425.00 | 0.56% |
| Novartis AG | 1.26% | 145.78 | -2.20% |
|
CASH AND CASH EQUIVALENTS
|
1.20% | -- | -- |
| Nestlé SA | 1.17% | 97.75 | -1.07% |
| Shell Plc | 1.17% | 44.25 | 1.33% |
Fees & Availability
| Fees | |
| Actual 12B-1 Fee | -- |
| Actual Management Fee | 0.35% |
| Administration Fee | -- |
| Maximum Front Load | -- |
| Maximum Deferred Load | -- |
| Maximum Redemption Fee | -- |
| General Availability | |
| Available for Insurance Product |
|
| Available for RRSP | No |
| Purchase Details | |
| Open to New Investors |
|
| Minimum Initial Investment | 0.00 None |
| Minimum Subsequent Investment | 0.00 None |
Basic Info
| Investment Strategy | |
| The Portfolio seeks results that correspond to the total return of the Morgan Stanley Capital International Europe, Australia and Far East Index which is a market value-weighted index that reflects the performance of approximately 1,100 securities listed on the stock exchanges of Europe, Australasia and the Far East. |
| General | |
| Security Type | Insurance Fund |
| Equity Style | Large Cap Core |
| Broad Asset Class | International Equity |
| Broad Category | Equity |
| Global Peer Group | Equity Global ex US |
| Peer Group | International Large-Cap Core |
| Global Macro | Equity Global |
| US Macro | Developed International Markets Funds |
| YCharts Categorization | -- |
| YCharts Benchmark | -- |
| Prospectus Objective | International Funds |
| Fund Owner Firm Name | Voya |
| Broad Asset Class Benchmark Index | |
| ^MSACXUSNTR | 100.0% |
Fundamentals
| General | |
| Distribution Yield | -- |
| Dividend Yield TTM (5-21-26) | 4.24% |
| 30-Day SEC Yield | -- |
| 7-Day SEC Yield | -- |
| Number of Holdings | 10 |
| Stock | |
| Weighted Average PE Ratio | 22.99 |
| Weighted Average Price to Sales Ratio | 3.578 |
| Weighted Average Price to Book Ratio | 4.199 |
| Weighted Median ROE | 21.04% |
| Weighted Median ROA | 6.31% |
| ROI (TTM) | 11.85% |
| Return on Investment (TTM) | 11.85% |
| Earning Yield | 0.0575 |
| LT Debt / Shareholders Equity | 0.7795 |
| Number of Equity Holdings | 6 |
As of March 31, 2026
Growth Metrics
| EPS Growth (1Y) | 18.27% |
| EPS Growth (3Y) | 10.63% |
| EPS Growth (5Y) | 17.45% |
| Sales Growth (1Y) | 5.44% |
| Sales Growth (3Y) | 5.77% |
| Sales Growth (5Y) | 8.02% |
| Sales per Share Growth (1Y) | 6.70% |
| Sales per Share Growth (3Y) | 6.96% |
| Operating Cash Flow - Growth Rate (3Y) | 10.85% |
As of March 31, 2026
Fund Details
Top Portfolio Holders
| Name | % Weight |
|---|---|
| Portfolio A | 5.00% |
| Portfolio B | 3.50% |
| Portfolio C | 2.25% |