

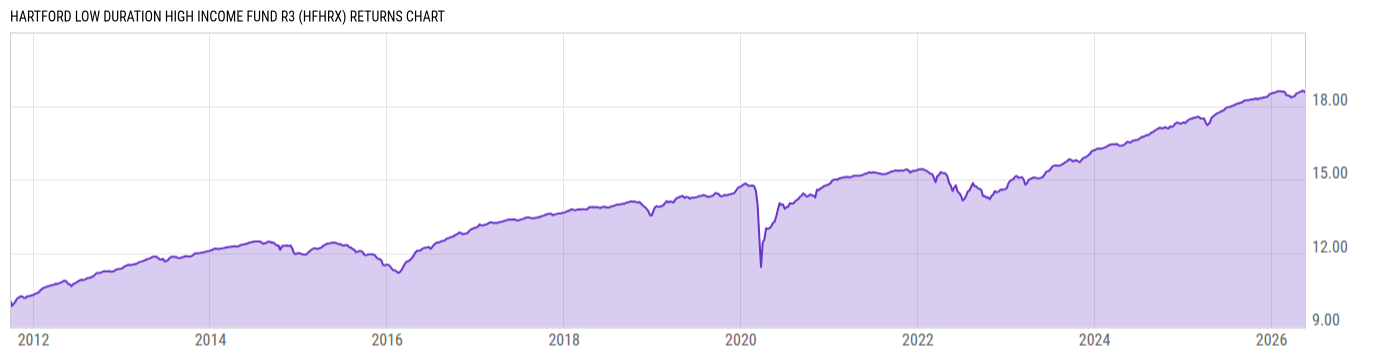
Hartford Low Duration High Income Fund R3 (HFHRX)
8.85
0.00 (0.00%)
USD |
Jun 09 2026
Returns Chart
Key Stats
| Net Expense Ratio | Total Assets Under Management | Weighted Average Dividend Yield | Turnover Ratio (Generic) |
|---|---|---|---|
| 1.32% | 142.07M | -- | 73.00% |
| 1 Year Fund Level Flows | 1 Year Total Returns (Daily) | Annualized Total Returns Since Inception (Daily) | Max Drawdown (Since Inception) |
| -13.39M | 4.67% |
Basic Info
| Investment Strategy | |
| The Fund seeks to provide a high level of income. The Fund seeks to achieve its investment objective by investing primarily in debt securities attractive from a yield perspective. Under normal circumstances, the Fund invests at least 65% of its net assets in non-investment grade debt securities, also known as junk bonds. |
| General | |
| Security Type | Mutual Fund |
| Equity Style | -- |
| Broad Asset Class | Taxable Bond |
| Broad Category | Fixed Income |
| Global Peer Group | Bond USD High Yield |
| Peer Group | Short High Yield Funds |
| Global Macro | Bond High Yield |
| US Macro | High Yield Funds |
| YCharts Categorization | -- |
| YCharts Benchmark | -- |
| Prospectus Objective | Short High Yield Funds |
| Fund Owner Firm Name | Hartford Funds |
| Broad Asset Class Benchmark Index | |
| ^BBUSATR | 100.0% |
Net Fund Flows Versus Peer Group
1 Month
% Rank:
57
-19.58M
Peer Group Low
108.89M
Peer Group High
1 Year
% Rank:
79
-13.39M
-186.17M
Peer Group Low
1.374B
Peer Group High
3 Months
% Rank:
66
-374.92M
Peer Group Low
476.36M
Peer Group High
3 Years
% Rank:
81
-428.04M
Peer Group Low
7.937B
Peer Group High
6 Months
% Rank:
64
-600.15M
Peer Group Low
534.52M
Peer Group High
5 Years
% Rank:
92
-918.94M
Peer Group Low
8.753B
Peer Group High
YTD
% Rank:
61
-547.97M
Peer Group Low
495.43M
Peer Group High
10 Years
% Rank:
81
-704.35M
Peer Group Low
8.768B
Peer Group High
Date Unavailable
Risk
Performance Versus Peer Group
Annual Total Returns Versus Peers
As of June 10, 2026.
Asset Allocation
As of March 31, 2026.
| Type | % Net |
|---|---|
| Cash | 0.00% |
| Stock | 0.14% |
| Bond | 97.29% |
| Convertible | 0.00% |
| Preferred | 0.00% |
| Other | 2.57% |
Top 10 Holdings
| Name | % Weight | Price | % Change |
|---|---|---|---|
|
2YR T-NOTE JUN26
|
28.47% | -- | -- |
|
Government National Mortgage Association 2 20-MAY-2055 MB0366
|
2.85% | -- | -- |
|
Government National Mortgage Association 2 20-OCT-2054 MA9965
|
2.13% | -- | -- |
|
Government National Mortgage Association 2 20-JAN-2055 MB0147
|
2.05% | -- | -- |
|
APIDOS CLO 18R2 CR2 SEQ FLT 5.5692% 22-JAN-2038
|
1.06% | -- | -- |
|
CIFC FUNDING LTD 184R ER SEQ FLT 8.51763% 19-JAN-2038
|
1.01% | -- | -- |
|
ALINEA CLO LTD 1R DR SEQ FLT 5.91763% 20-JUL-2031
|
0.98% | -- | -- |
|
PALMER SQUARE CLO 211R DR SEQ FLT 8.41763% 20-APR-2038
|
0.97% | -- | -- |
|
FREDDIE MAC STACR REMIC TRUST 22HQA1 M2 FLT 8.9119% 25-MAR-2042
|
0.87% | -- | -- |
|
SYMPHONY CLO, LTD. 22 E SEQ FLT 10.17924% 18-APR-2033
|
0.87% | -- | -- |
Fees & Availability
| Fees | |
| Actual 12B-1 Fee | 0.50% |
| Actual Management Fee | 0.44% |
| Administration Fee | -- |
| Maximum Front Load | -- |
| Maximum Deferred Load | -- |
| Maximum Redemption Fee | -- |
| General Availability | |
| Available for Insurance Product | No |
| Available for RRSP | No |
| Purchase Details | |
| Open to New Investors |
|
| Minimum Initial Investment | 0.00 None |
| Minimum Subsequent Investment | 0.00 None |
Basic Info
| Investment Strategy | |
| The Fund seeks to provide a high level of income. The Fund seeks to achieve its investment objective by investing primarily in debt securities attractive from a yield perspective. Under normal circumstances, the Fund invests at least 65% of its net assets in non-investment grade debt securities, also known as junk bonds. |
| General | |
| Security Type | Mutual Fund |
| Equity Style | -- |
| Broad Asset Class | Taxable Bond |
| Broad Category | Fixed Income |
| Global Peer Group | Bond USD High Yield |
| Peer Group | Short High Yield Funds |
| Global Macro | Bond High Yield |
| US Macro | High Yield Funds |
| YCharts Categorization | -- |
| YCharts Benchmark | -- |
| Prospectus Objective | Short High Yield Funds |
| Fund Owner Firm Name | Hartford Funds |
| Broad Asset Class Benchmark Index | |
| ^BBUSATR | 100.0% |
Fundamentals
| General | |
| Distribution Yield | -- |
| Dividend Yield TTM (6-8-26) | 6.72% |
| 30-Day SEC Yield (5-31-26) | 6.00% |
| 7-Day SEC Yield | -- |
| Number of Holdings | 309 |
| Bond | |
| Yield to Maturity (3-31-26) | 6.72% |
| Effective Duration | 1.36 |
| Average Coupon | 7.22% |
| Calculated Average Quality | 4.676 |
| Effective Maturity | 12.27 |
| Nominal Maturity | 12.34 |
| Number of Bond Holdings | 290 |
As of March 31, 2026
Fund Details
| Key Dates | |
| Inception Date | 9/30/2011 |
| Last Annual Report Date | 10/31/2025 |
| Last Prospectus Date | 2/27/2026 |
| Share Classes | |
| HFHAX | A |
| HFHCX | C |
| HFHFX | F |
| HFHIX | Inst |
| HFHSX | Retirement |
| HFHTX | Retirement |
| HFHYX | Inst |
| Attributes | |
| Index Fund | -- |
| Inverse Fund | No |
| Leveraged Fund | -- |
| Fund of Funds | No |
| Currency Hedged Fund | -- |
| Socially Responsible Fund | No |
Top Portfolio Holders
| Name | % Weight |
|---|---|
| Portfolio A | 5.00% |
| Portfolio B | 3.50% |
| Portfolio C | 2.25% |
Excel Add-In Codes
| Name: =YCI("M:HFHRX", "name") |
| Broad Asset Class: =YCI("M:HFHRX", "broad_asset_class") |
| Broad Category: =YCI("M:HFHRX", "broad_category_group") |
| Prospectus Objective: =YCI("M:HFHRX", "prospectus_objective") |
| To find the codes for any of our securities and financial metrics, see our Complete Excel Reference. |