

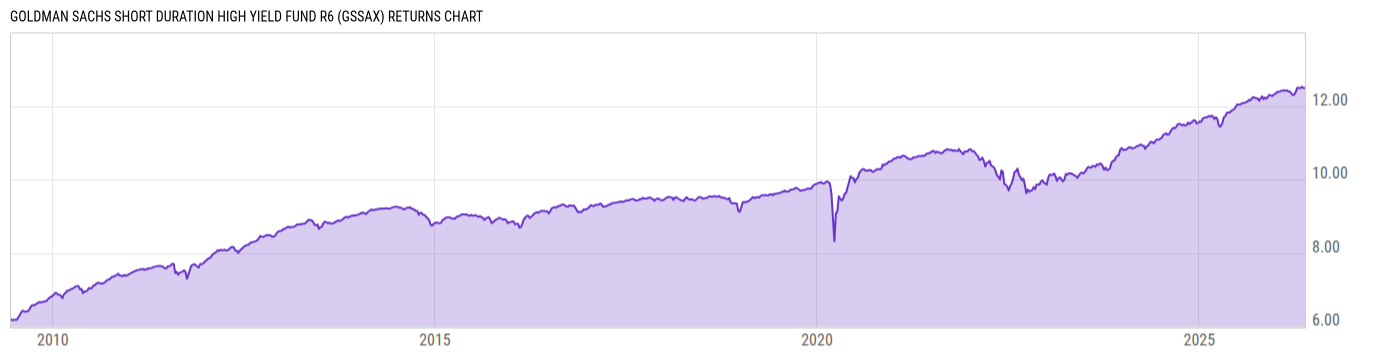
Goldman Sachs Short Duration High Yield Fund R6 (GSSAX)
7.87
0.00 (0.00%)
USD |
Jun 09 2026
Returns Chart
Key Stats
| Net Expense Ratio | Total Assets Under Management | Weighted Average Dividend Yield | Turnover Ratio (Generic) |
|---|---|---|---|
| 0.61% | 38.64M | -- | 56.00% |
| 1 Year Fund Level Flows | 1 Year Total Returns (Daily) | Annualized Total Returns Since Inception (Daily) | Max Drawdown (Since Inception) |
| -1.730M | 5.17% |
Basic Info
| Investment Strategy | |
| The Fund seeks total return consisting of a high level of current income and capital appreciation. It invests, under normal circumstances, at least 80% of its net assets plus any borrowings for investment purposes in high-yield, fixed income securities that, at the time of purchase, are non-investment grade securities. |
| General | |
| Security Type | Mutual Fund |
| Equity Style | -- |
| Broad Asset Class | Taxable Bond |
| Broad Category | Fixed Income |
| Global Peer Group | Bond USD High Yield |
| Peer Group | Short High Yield Funds |
| Global Macro | Bond High Yield |
| US Macro | High Yield Funds |
| YCharts Categorization | -- |
| YCharts Benchmark | -- |
| Prospectus Objective | Short High Yield Funds |
| Fund Owner Firm Name | Goldman Sachs |
| Broad Asset Class Benchmark Index | |
| ^BBUSATR | 100.0% |
Net Fund Flows Versus Peer Group
1 Month
% Rank:
35
-19.58M
Peer Group Low
108.89M
Peer Group High
1 Year
% Rank:
67
-1.730M
-186.17M
Peer Group Low
1.374B
Peer Group High
3 Months
% Rank:
57
-374.92M
Peer Group Low
476.36M
Peer Group High
3 Years
% Rank:
69
-428.04M
Peer Group Low
7.937B
Peer Group High
6 Months
% Rank:
47
-600.15M
Peer Group Low
534.52M
Peer Group High
5 Years
% Rank:
75
-918.94M
Peer Group Low
8.753B
Peer Group High
YTD
% Rank:
47
-547.97M
Peer Group Low
495.43M
Peer Group High
10 Years
% Rank:
72
-704.35M
Peer Group Low
8.768B
Peer Group High
Date Unavailable
Risk
Performance Versus Peer Group
Annual Total Returns Versus Peers
As of June 10, 2026.
Asset Allocation
As of March 31, 2026.
| Type | % Net |
|---|---|
| Cash | 3.27% |
| Stock | 0.02% |
| Bond | 96.25% |
| Convertible | 0.00% |
| Preferred | 0.08% |
| Other | 0.38% |
Top 10 Holdings
| Name | % Weight | Price | % Change |
|---|---|---|---|
|
2YR T-NOTE JUN26
|
20.57% | -- | -- |
| Goldman Sachs FS Government Fund Institutional | 3.20% | 1.00 | 0.00% |
|
USD Cash
|
1.38% | -- | -- |
| CCO Holdings, LLC CHTR-CCOH 4.25 01/15/2034 FIX USD Corporate 144A | 1.31% | 82.75 | 0.10% |
| API GROUP DE, INC. APGROU 4.125 07/15/2029 FIX USD Corporate 144A | 1.20% | 96.13 | -0.23% |
| ACRISURE, LLC ACRILLC 6.0 08/01/2029 FIX USD Corporate 144A | 0.89% | 91.48 | -1.02% |
| Kinetik Holdings LP KINETIH 5.875 06/15/2030 FIX USD Corporate 144A | 0.87% | 100.37 | 0.06% |
| Carnival Corporation Ltd. CARNIVC 5.875 06/15/2031 FIX USD Corporate 144A | 0.81% | 100.86 | -0.15% |
| LCM Investments Holdings II, LLC LCMINV 4.875 05/01/2029 FIX USD Corporate 144A | 0.79% | 97.64 | -0.12% |
| ANGI Group, LLC ANGIGRO 3.875 08/15/2028 FIX USD Corporate 144A | 0.77% | 88.18 | -1.03% |
Fees & Availability
| Fees | |
| Actual 12B-1 Fee | -- |
| Actual Management Fee | 0.12% |
| Administration Fee | -- |
| Maximum Front Load | -- |
| Maximum Deferred Load | -- |
| Maximum Redemption Fee | -- |
| General Availability | |
| Available for Insurance Product | No |
| Available for RRSP | No |
| Purchase Details | |
| Open to New Investors |
|
| Minimum Initial Investment | 0.00 None |
| Minimum Subsequent Investment | 0.00 None |
Basic Info
| Investment Strategy | |
| The Fund seeks total return consisting of a high level of current income and capital appreciation. It invests, under normal circumstances, at least 80% of its net assets plus any borrowings for investment purposes in high-yield, fixed income securities that, at the time of purchase, are non-investment grade securities. |
| General | |
| Security Type | Mutual Fund |
| Equity Style | -- |
| Broad Asset Class | Taxable Bond |
| Broad Category | Fixed Income |
| Global Peer Group | Bond USD High Yield |
| Peer Group | Short High Yield Funds |
| Global Macro | Bond High Yield |
| US Macro | High Yield Funds |
| YCharts Categorization | -- |
| YCharts Benchmark | -- |
| Prospectus Objective | Short High Yield Funds |
| Fund Owner Firm Name | Goldman Sachs |
| Broad Asset Class Benchmark Index | |
| ^BBUSATR | 100.0% |
Fundamentals
| General | |
| Distribution Yield | -- |
| Dividend Yield TTM (6-8-26) | 6.04% |
| 30-Day SEC Yield (4-30-26) | 5.66% |
| 7-Day SEC Yield | -- |
| Number of Holdings | 349 |
| Bond | |
| Yield to Maturity (3-31-26) | 6.59% |
| Effective Duration | 2.20 |
| Average Coupon | 6.42% |
| Calculated Average Quality | 5.538 |
| Effective Maturity | 4.799 |
| Nominal Maturity | 5.220 |
| Number of Bond Holdings | 335 |
As of March 31, 2026
Fund Details
Top Portfolio Holders
| Name | % Weight |
|---|---|
| Portfolio A | 5.00% |
| Portfolio B | 3.50% |
| Portfolio C | 2.25% |
Excel Add-In Codes
| Name: =YCI("M:GSSAX", "name") |
| Broad Asset Class: =YCI("M:GSSAX", "broad_asset_class") |
| Broad Category: =YCI("M:GSSAX", "broad_category_group") |
| Prospectus Objective: =YCI("M:GSSAX", "prospectus_objective") |
| To find the codes for any of our securities and financial metrics, see our Complete Excel Reference. |