

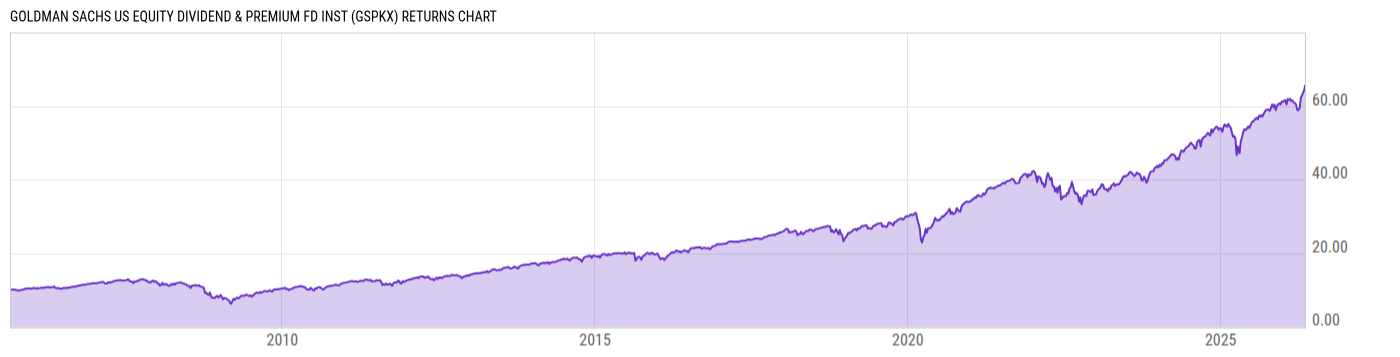
Goldman Sachs US Equity Dividend & Premium Fd Inst (GSPKX)
19.96
+0.03
(+0.15%)
USD |
May 29 2026
Returns Chart
Key Stats
| Net Expense Ratio | Total Assets Under Management | Weighted Average Dividend Yield | Turnover Ratio (Generic) |
|---|---|---|---|
| 0.68% | 3.885B | 1.64% | 29.00% |
| 1 Year Fund Level Flows | 1 Year Total Returns (Daily) | Annualized Total Returns Since Inception (Daily) | Max Drawdown (Since Inception) |
| -376.96M | 25.52% |
Basic Info
| Investment Strategy | |
| The Fund seeks to maximize income and total return. The Fund invests, under normal circumstances, at least 80% of its net assets in dividend-paying equities of large-cap U.S. issuers with public stock market capitalizations within the range of the market capitalization of the S&P 500 Index at the time of investment. |
| General | |
| Security Type | Mutual Fund |
| Equity Style | Large Cap Core |
| Broad Asset Class | US Equity |
| Broad Category | Equity |
| Global Peer Group | Equity US Income |
| Peer Group | Equity Income Funds |
| Global Macro | Equity North America |
| US Macro | Equity Income Funds |
| YCharts Categorization | -- |
| YCharts Benchmark | -- |
| Prospectus Objective | Equity Income Funds |
| Fund Owner Firm Name | Goldman Sachs |
| Broad Asset Class Benchmark Index | |
| ^SPXTR | 100.0% |
Net Fund Flows Versus Peer Group
1 Month
% Rank:
78
-1.131B
Peer Group Low
2.598B
Peer Group High
1 Year
% Rank:
74
-376.96M
-13.00B
Peer Group Low
11.56B
Peer Group High
3 Months
% Rank:
81
-2.838B
Peer Group Low
6.150B
Peer Group High
3 Years
% Rank:
68
-25.75B
Peer Group Low
23.13B
Peer Group High
6 Months
% Rank:
77
-7.051B
Peer Group Low
9.275B
Peer Group High
5 Years
% Rank:
68
-27.88B
Peer Group Low
42.64B
Peer Group High
YTD
% Rank:
78
-3.904B
Peer Group Low
9.031B
Peer Group High
10 Years
% Rank:
64
-30.34B
Peer Group Low
55.29B
Peer Group High
Date Unavailable
Risk
Performance Versus Peer Group
Annual Total Returns Versus Peers
As of May 30, 2026.
Asset Allocation
As of December 31, 2025.
| Type | % Net |
|---|---|
| Cash | 0.03% |
| Stock | 100.3% |
| Bond | 0.00% |
| Convertible | 0.00% |
| Preferred | 0.00% |
| Other | -0.33% |
Top 10 Holdings
| Name | % Weight | Price | % Change |
|---|---|---|---|
| NVIDIA Corp. | 8.01% | 211.14 | -1.45% |
| Apple, Inc. | 7.14% | 312.06 | -0.14% |
| Microsoft Corp. | 6.16% | 450.24 | 5.45% |
| Alphabet, Inc. | 4.87% | 380.34 | -2.51% |
| Amazon.com, Inc. | 3.93% | 270.64 | -1.23% |
| Broadcom Inc. | 2.98% | 446.77 | 4.73% |
| Meta Platforms, Inc. | 2.54% | 632.51 | -0.44% |
| Tesla, Inc. | 2.30% | 435.79 | -1.43% |
| JPMorgan Chase & Co. | 1.45% | 299.31 | 0.87% |
| Eli Lilly & Co. | 1.44% | 1105.00 | -1.93% |
Fees & Availability
| Fees | |
| Actual 12B-1 Fee | -- |
| Actual Management Fee | 0.62% |
| Administration Fee | -- |
| Maximum Front Load | -- |
| Maximum Deferred Load | -- |
| Maximum Redemption Fee | -- |
| General Availability | |
| Available for Insurance Product | No |
| Available for RRSP | No |
| Purchase Details | |
| Open to New Investors |
|
| Minimum Initial Investment | 1.00M None |
| Minimum Subsequent Investment | 0.00 None |
Basic Info
| Investment Strategy | |
| The Fund seeks to maximize income and total return. The Fund invests, under normal circumstances, at least 80% of its net assets in dividend-paying equities of large-cap U.S. issuers with public stock market capitalizations within the range of the market capitalization of the S&P 500 Index at the time of investment. |
| General | |
| Security Type | Mutual Fund |
| Equity Style | Large Cap Core |
| Broad Asset Class | US Equity |
| Broad Category | Equity |
| Global Peer Group | Equity US Income |
| Peer Group | Equity Income Funds |
| Global Macro | Equity North America |
| US Macro | Equity Income Funds |
| YCharts Categorization | -- |
| YCharts Benchmark | -- |
| Prospectus Objective | Equity Income Funds |
| Fund Owner Firm Name | Goldman Sachs |
| Broad Asset Class Benchmark Index | |
| ^SPXTR | 100.0% |
Fundamentals
| General | |
| Distribution Yield | -- |
| Dividend Yield TTM (5-28-26) | 1.03% |
| 30-Day SEC Yield (4-30-26) | 1.01% |
| 7-Day SEC Yield | -- |
| Number of Holdings | 192 |
| Stock | |
| Weighted Average PE Ratio | 33.47 |
| Weighted Average Price to Sales Ratio | 9.014 |
| Weighted Average Price to Book Ratio | 11.55 |
| Weighted Median ROE | 47.71% |
| Weighted Median ROA | 17.75% |
| ROI (TTM) | 25.05% |
| Return on Investment (TTM) | 25.05% |
| Earning Yield | 0.0377 |
| LT Debt / Shareholders Equity | 0.9844 |
| Number of Equity Holdings | 185 |
As of December 31, 2025
Growth Metrics
| EPS Growth (1Y) | 30.78% |
| EPS Growth (3Y) | 15.90% |
| EPS Growth (5Y) | 21.51% |
| Sales Growth (1Y) | 17.11% |
| Sales Growth (3Y) | 12.71% |
| Sales Growth (5Y) | 15.23% |
| Sales per Share Growth (1Y) | 20.42% |
| Sales per Share Growth (3Y) | 13.36% |
| Operating Cash Flow - Growth Rate (3Y) | 16.11% |
As of December 31, 2025
Fund Details
Top Portfolio Holders
| Name | % Weight |
|---|---|
| Portfolio A | 5.00% |
| Portfolio B | 3.50% |
| Portfolio C | 2.25% |
Excel Add-In Codes
| Name: =YCI("M:GSPKX", "name") |
| Broad Asset Class: =YCI("M:GSPKX", "broad_asset_class") |
| Broad Category: =YCI("M:GSPKX", "broad_category_group") |
| Prospectus Objective: =YCI("M:GSPKX", "prospectus_objective") |
| To find the codes for any of our securities and financial metrics, see our Complete Excel Reference. |