

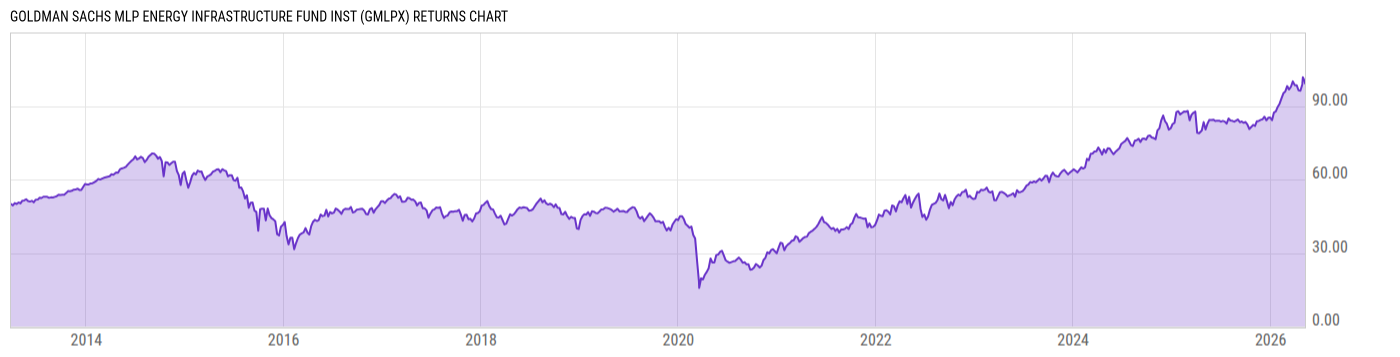
Goldman Sachs MLP Energy Infrastructure Fund Inst (GMLPX)
42.88
-0.28
(-0.65%)
USD |
Jun 09 2026
Returns Chart
Key Stats
| Net Expense Ratio | Total Assets Under Management | Weighted Average Dividend Yield | Turnover Ratio (Generic) |
|---|---|---|---|
| 1.06% | 1.811B | -- | 130.0% |
| 1 Year Fund Level Flows | 1 Year Total Returns (Daily) | Annualized Total Returns Since Inception (Daily) | Max Drawdown (Since Inception) |
| -125.63M | 19.14% |
Basic Info
| Investment Strategy | |
| The Fund seeks total return through current income and capital appreciation. Under normal circumstances, the Fund invests at least 80% of its net assets plus any borrowings for investment purposes (measured at the time of purchase) (Net Assets) in energy infrastructure master limited partnership (MLP) investments. |
| General | |
| Security Type | Mutual Fund |
| Equity Style | -- |
| Broad Asset Class | Sector Equity |
| Broad Category | Equity |
| Global Peer Group | Equity Sector Energy |
| Peer Group | Energy MLP Funds |
| Global Macro | Equity Industry Sector |
| US Macro | Sector Equity Funds |
| YCharts Categorization | -- |
| YCharts Benchmark | -- |
| Prospectus Objective | Energy MLP Funds |
| Fund Owner Firm Name | Goldman Sachs |
| Broad Asset Class Benchmark Index | |
| ^MSWNTR | 100.0% |
Net Fund Flows Versus Peer Group
1 Month
% Rank:
57
-138.04M
Peer Group Low
174.91M
Peer Group High
1 Year
% Rank:
72
-125.63M
-303.08M
Peer Group Low
603.68M
Peer Group High
3 Months
% Rank:
54
-99.09M
Peer Group Low
306.82M
Peer Group High
3 Years
% Rank:
85
-779.05M
Peer Group Low
1.264B
Peer Group High
6 Months
% Rank:
55
-155.80M
Peer Group Low
603.68M
Peer Group High
5 Years
% Rank:
79
-1.420B
Peer Group Low
1.164B
Peer Group High
YTD
% Rank:
55
-126.55M
Peer Group Low
576.69M
Peer Group High
10 Years
% Rank:
76
-2.992B
Peer Group Low
1.824B
Peer Group High
Date Unavailable
Risk
Performance Versus Peer Group
Annual Total Returns Versus Peers
As of June 10, 2026.
Asset Allocation
As of February 28, 2026.
| Type | % Net |
|---|---|
| Cash | 1.00% |
| Stock | 36.97% |
| Bond | 0.33% |
| Convertible | 0.00% |
| Preferred | 0.00% |
| Other | 61.70% |
Top 10 Holdings
| Name | % Weight | Price | % Change |
|---|---|---|---|
| MPLX LP | 12.46% | 56.59 | 0.16% |
| Energy Transfer LP | 11.58% | 19.10 | 0.21% |
| Plains All American Pipeline LP | 9.62% | 22.96 | 2.20% |
| Enterprise Products Partners LP | 8.15% | 37.89 | 1.45% |
| Hess Midstream LP | 7.70% | 39.01 | 1.11% |
| Western Midstream Partners LP | 7.59% | 44.83 | 3.06% |
| Sunoco LP | 5.47% | 66.28 | 3.21% |
| DT Midstream, Inc. | 3.76% | 142.16 | 1.10% |
| Targa Resources Corp. | 3.59% | 272.24 | 3.06% |
| Cheniere Energy, Inc. | 3.01% | 243.69 | 1.79% |
Fees & Availability
| Fees | |
| Actual 12B-1 Fee | -- |
| Actual Management Fee | 0.96% |
| Administration Fee | -- |
| Maximum Front Load | -- |
| Maximum Deferred Load | -- |
| Maximum Redemption Fee | -- |
| General Availability | |
| Available for Insurance Product | No |
| Available for RRSP | No |
| Purchase Details | |
| Open to New Investors |
|
| Minimum Initial Investment | 1.00M None |
| Minimum Subsequent Investment | 0.00 None |
Basic Info
| Investment Strategy | |
| The Fund seeks total return through current income and capital appreciation. Under normal circumstances, the Fund invests at least 80% of its net assets plus any borrowings for investment purposes (measured at the time of purchase) (Net Assets) in energy infrastructure master limited partnership (MLP) investments. |
| General | |
| Security Type | Mutual Fund |
| Equity Style | -- |
| Broad Asset Class | Sector Equity |
| Broad Category | Equity |
| Global Peer Group | Equity Sector Energy |
| Peer Group | Energy MLP Funds |
| Global Macro | Equity Industry Sector |
| US Macro | Sector Equity Funds |
| YCharts Categorization | -- |
| YCharts Benchmark | -- |
| Prospectus Objective | Energy MLP Funds |
| Fund Owner Firm Name | Goldman Sachs |
| Broad Asset Class Benchmark Index | |
| ^MSWNTR | 100.0% |
Fundamentals
| General | |
| Distribution Yield | -- |
| Dividend Yield TTM (6-8-26) | 6.23% |
| 30-Day SEC Yield (4-30-26) | -10.47% |
| 7-Day SEC Yield | -- |
| Number of Holdings | 34 |
Fund Details
| Key Dates | |
| Inception Date | 3/28/2013 |
| Last Annual Report Date | 11/30/2025 |
| Last Prospectus Date | 3/30/2026 |
| Share Classes | |
| GLPAX | A |
| GLPCX | C |
| GLPIX | Inv |
| GLPRX | Retirement |
| GLPSX | Retirement |
| GMNPX | P |
| Attributes | |
| Index Fund | -- |
| Inverse Fund | No |
| Leveraged Fund | -- |
| Fund of Funds | No |
| Currency Hedged Fund | -- |
| Socially Responsible Fund | No |
Top Portfolio Holders
| Name | % Weight |
|---|---|
| Portfolio A | 5.00% |
| Portfolio B | 3.50% |
| Portfolio C | 2.25% |
Excel Add-In Codes
| Name: =YCI("M:GMLPX", "name") |
| Broad Asset Class: =YCI("M:GMLPX", "broad_asset_class") |
| Broad Category: =YCI("M:GMLPX", "broad_category_group") |
| Prospectus Objective: =YCI("M:GMLPX", "prospectus_objective") |
| To find the codes for any of our securities and financial metrics, see our Complete Excel Reference. |