

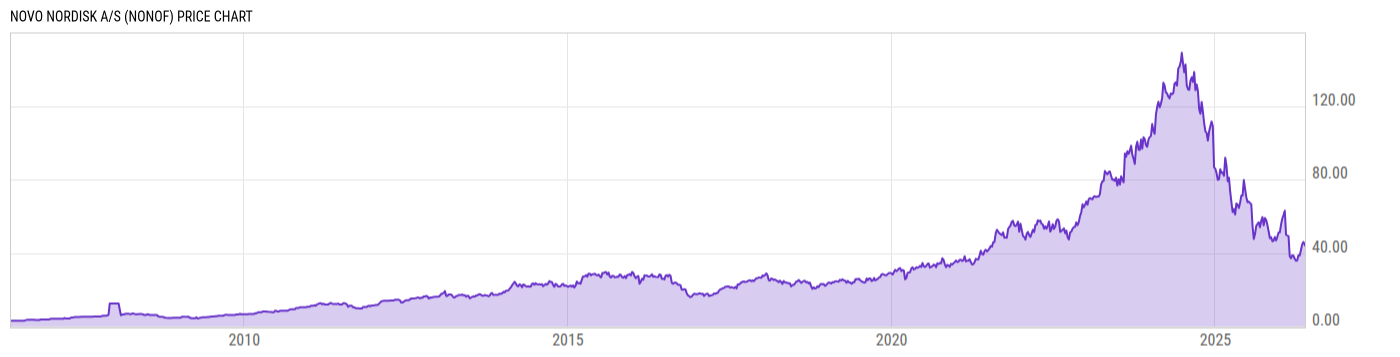
Novo Nordisk A/S (NONOF)
44.64
+0.18
(+0.41%)
USD |
OTCM |
May 19, 15:51
Price Chart
Key Stats
| Price and Performance | |
|---|---|
| Market Cap | 197.85B |
| 52 Week High (Daily) | |
| 52 Week Low (Daily) | |
| All-Time High (Daily) | |
| Year to Date Total Returns (Daily) | |
| 1 Month Total Returns (Daily) | |
| 1 Year Total Returns (Daily) | -26.53% |
| Valuation | |
| PE Ratio | 10.48 |
| PE Ratio (Forward) | |
| PS Ratio | 3.900 |
| Price to Book Value | 6.319 |
| EV to EBITDA | |
| Dividend | |
|---|---|
| Dividend | 1.222 |
| Dividend Yield (Forward) | |
| Financials | |
| Revenue (5 Year Growth) | |
| Revenue (Quarterly YoY Growth) | |
| EPS Diluted (5 Year Growth) | |
| EPS Diluted (Quarterly YoY Growth) | |
| Debt to Equity Ratio | 0.7209 |
| Return on Equity | |
| Return on Assets | |
| Risk | |
| Beta (5Y) | |
| Max Drawdown (5Y) | 75.56% |
Profile
| Novo Nordisk A/S is a global healthcare company, which engages in the discovery, development, manufacturing and marketing of pharmaceutical products. It operates through the Diabetes and Obesity Care and Rare Disease segments. The Diabetes and Obesity Care segment includes diabetes, obesity, cardiovascular, and emerging therapy areas. The Rare Disease segment refers to rare blood disorders, rare endocrine disorders, and hormone replacement therapy. The company was founded by Harald Pedersen and Thorvald Pedersen in 1923 is headquartered in Bagsværd, Denmark. |
| URL | http://www.novonordisk.com |
| Investor Relations URL | https://www.novonordisk.com/investors.html |
| HQ State/Province | Capital Region |
| Sector | Health Care |
| Industry | Pharmaceuticals |
| Next Earnings Release | Aug. 05, 2026 (est.) |
| Last Earnings Release | May. 06, 2026 |
| Next Ex-Dividend Date | N/A |
| Last Ex-Dividend Date | Mar. 30, 2026 |