

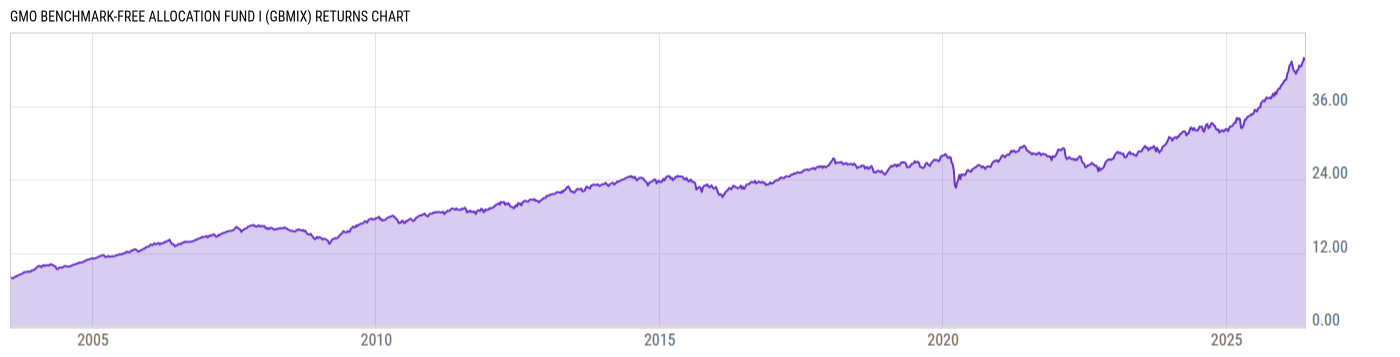
GMO Benchmark-Free Allocation Fund I (GBMIX)
33.31
-0.01
(-0.03%)
USD |
Jun 09 2026
Returns Chart
Key Stats
| Net Expense Ratio | Total Assets Under Management | Weighted Average Dividend Yield | Turnover Ratio (Generic) |
|---|---|---|---|
| 0.78% | 2.578B | -- | 11.00% |
| 1 Year Fund Level Flows | 1 Year Total Returns (Daily) | Annualized Total Returns Since Inception (Daily) | Max Drawdown (Since Inception) |
| -246.27M | 25.93% |
Basic Info
| Investment Strategy | |
| The Fund seeks a positive return, regardless of market direction. The Fund will not seek to control risk relative to a particular securities market index or benchmark. The Fund is a fund of funds and invests in shares of the GMO International Equity Funds, the GMO U.S. Equity Funds, and the GMO Fixed Income Funds. |
| General | |
| Security Type | Mutual Fund |
| Equity Style | -- |
| Broad Asset Class | Alternative |
| Broad Category | Alternative Strategies |
| Global Peer Group | Alternative Global Macro |
| Peer Group | Alternative Global Macro Funds |
| Global Macro | Liquid Alternatives |
| US Macro | Alternative Equity Funds |
| YCharts Categorization | -- |
| YCharts Benchmark | -- |
| Prospectus Objective | Alternative Global Macro Funds |
| Fund Owner Firm Name | GMO |
| Broad Asset Class Benchmark Index | |
| ^MSACWINTR | 100.0% |
Net Fund Flows Versus Peer Group
1 Month
% Rank:
72
-32.29M
Peer Group Low
445.62M
Peer Group High
1 Year
% Rank:
90
-246.27M
-2.362B
Peer Group Low
2.464B
Peer Group High
3 Months
% Rank:
79
-65.51M
Peer Group Low
885.16M
Peer Group High
3 Years
% Rank:
90
-6.710B
Peer Group Low
3.190B
Peer Group High
6 Months
% Rank:
95
-289.08M
Peer Group Low
1.556B
Peer Group High
5 Years
% Rank:
95
-8.867B
Peer Group Low
3.112B
Peer Group High
YTD
% Rank:
90
-129.84M
Peer Group Low
1.443B
Peer Group High
10 Years
% Rank:
90
-17.87B
Peer Group Low
3.792B
Peer Group High
Date Unavailable
Risk
Performance Versus Peer Group
Annual Total Returns Versus Peers
As of June 10, 2026.
Asset Allocation
As of February 28, 2026.
| Type | % Net |
|---|---|
| Cash | 2.03% |
| Stock | 7.83% |
| Bond | 6.84% |
| Convertible | 0.00% |
| Preferred | 0.02% |
| Other | 83.28% |
Top 7 Holdings
| Name | % Weight | Price | % Change |
|---|---|---|---|
| GMO Implementation | 83.01% | 17.13 | -0.06% |
| GMO Alternative Allocation Fund VI | 12.96% | 18.89 | 0.37% |
| GMO Opportunistic Income Fund VI | 2.00% | 24.22 | 0.08% |
| GMO Climate Change Fund III | 0.98% | 29.60 | -1.14% |
| GMO High Yield Fund VI | 0.98% | 17.48 | 0.06% |
| State Street Institutional Treasury MM Fund Inv | 0.13% | 1.00 | 0.00% |
|
Other Assets less Liabilities
|
-0.06% | -- | -- |
Fees & Availability
| Fees | |
| Actual 12B-1 Fee | -- |
| Actual Management Fee | 0.75% |
| Administration Fee | -- |
| Maximum Front Load | -- |
| Maximum Deferred Load | -- |
| Maximum Redemption Fee | -- |
| General Availability | |
| Available for Insurance Product | No |
| Available for RRSP | No |
| Purchase Details | |
| Open to New Investors |
|
| Minimum Initial Investment | 0.00 None |
| Minimum Subsequent Investment | 0.00 None |
Basic Info
| Investment Strategy | |
| The Fund seeks a positive return, regardless of market direction. The Fund will not seek to control risk relative to a particular securities market index or benchmark. The Fund is a fund of funds and invests in shares of the GMO International Equity Funds, the GMO U.S. Equity Funds, and the GMO Fixed Income Funds. |
| General | |
| Security Type | Mutual Fund |
| Equity Style | -- |
| Broad Asset Class | Alternative |
| Broad Category | Alternative Strategies |
| Global Peer Group | Alternative Global Macro |
| Peer Group | Alternative Global Macro Funds |
| Global Macro | Liquid Alternatives |
| US Macro | Alternative Equity Funds |
| YCharts Categorization | -- |
| YCharts Benchmark | -- |
| Prospectus Objective | Alternative Global Macro Funds |
| Fund Owner Firm Name | GMO |
| Broad Asset Class Benchmark Index | |
| ^MSACWINTR | 100.0% |
Fundamentals
| General | |
| Distribution Yield | -- |
| Dividend Yield TTM (6-8-26) | 3.72% |
| 30-Day SEC Yield | -- |
| 7-Day SEC Yield | -- |
| Number of Holdings | 7 |
Top Portfolio Holders
| Name | % Weight |
|---|---|
| Portfolio A | 5.00% |
| Portfolio B | 3.50% |
| Portfolio C | 2.25% |
Excel Add-In Codes
| Name: =YCI("M:GBMIX", "name") |
| Broad Asset Class: =YCI("M:GBMIX", "broad_asset_class") |
| Broad Category: =YCI("M:GBMIX", "broad_category_group") |
| Prospectus Objective: =YCI("M:GBMIX", "prospectus_objective") |
| To find the codes for any of our securities and financial metrics, see our Complete Excel Reference. |