

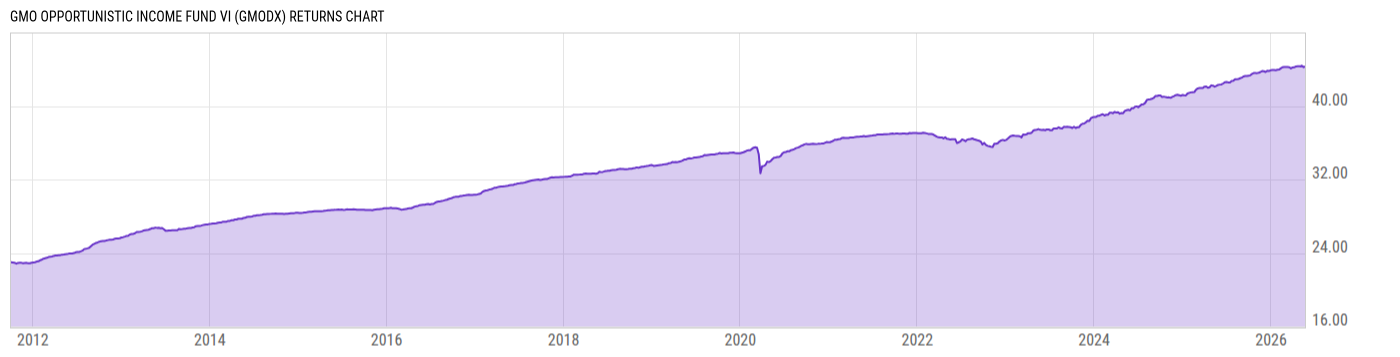
GMO Opportunistic Income Fund VI (GMODX)
24.22
+0.02
(+0.08%)
USD |
Jun 09 2026
Returns Chart
Key Stats
| Net Expense Ratio | Total Assets Under Management | Weighted Average Dividend Yield | Turnover Ratio (Generic) |
|---|---|---|---|
| 0.49% | 1.272B | -- | 277.0% |
| 1 Year Fund Level Flows | 1 Year Total Returns (Daily) | Annualized Total Returns Since Inception (Daily) | Max Drawdown (Since Inception) |
| -68.71M | 4.74% |
Basic Info
| Investment Strategy | |
| The Fund seeks capital appreciation and current income. The Fund invests primarily in debt investments and is not restricted in its exposure to any debt investment regardless of credit rating. It may invest in debt investments issued by a wide range of private issuers and by federal, state, local, and non-US governments. |
| General | |
| Security Type | Mutual Fund |
| Equity Style | -- |
| Broad Asset Class | Taxable Bond |
| Broad Category | Alternative Strategies |
| Global Peer Group | Alternative Credit Focus |
| Peer Group | Alternative Credit Focus Funds |
| Global Macro | Alternative Bond |
| US Macro | Alternative Bond Funds |
| YCharts Categorization | -- |
| YCharts Benchmark | -- |
| Prospectus Objective | Alternative Credit Focus Funds |
| Fund Owner Firm Name | GMO |
| Broad Asset Class Benchmark Index | |
| ^BBUSATR | 100.0% |
Net Fund Flows Versus Peer Group
1 Month
% Rank:
45
-11.14M
Peer Group Low
168.46M
Peer Group High
1 Year
% Rank:
88
-68.71M
-914.98M
Peer Group Low
3.343B
Peer Group High
3 Months
% Rank:
42
-264.79M
Peer Group Low
869.06M
Peer Group High
3 Years
% Rank:
88
-703.80M
Peer Group Low
4.117B
Peer Group High
6 Months
% Rank:
74
-407.31M
Peer Group Low
2.256B
Peer Group High
5 Years
% Rank:
55
-1.870B
Peer Group Low
2.716B
Peer Group High
YTD
% Rank:
33
-301.59M
Peer Group Low
2.047B
Peer Group High
10 Years
% Rank:
83
-11.22B
Peer Group Low
6.503B
Peer Group High
Date Unavailable
Risk
Performance Versus Peer Group
Annual Total Returns Versus Peers
As of June 09, 2026.
Asset Allocation
As of February 28, 2026.
| Type | % Net |
|---|---|
| Cash | 8.19% |
| Stock | 0.00% |
| Bond | 90.40% |
| Convertible | 0.00% |
| Preferred | 0.00% |
| Other | 1.41% |
Top 10 Holdings
| Name | % Weight | Price | % Change |
|---|---|---|---|
| United States of America USGB 04/30/2027 FLT USD Government | 8.69% | 100.13 | -0.03% |
|
Daiwa Capital Markets America Inc Repo
|
7.00% | -- | -- |
| United States of America USGB 01/31/2028 FLT USD Government | 3.50% | 100.18 | -0.06% |
|
COMM MORTGAGE TRUST 18COR3 A3 FIX 4.228% 12-MAY-2051
|
2.07% | -- | -- |
|
EATON VANCE CLO LTD 141RR BR SEQ FLT 15-JUL-2030
|
1.61% | -- | -- |
|
TOWD POINT ASSET TRUST 21SL1 C SEQ FLT 5.8549% 21-NOV-2061
|
1.39% | -- | -- |
|
BENCHMARK MORTGAGE TRUST 20B20 A5 FIX 2.0341% 15-OCT-2053
|
1.35% | -- | -- |
|
COMM MORTGAGE TRUST 24277P A FIX 6.338% 11-AUG-2044
|
1.30% | -- | -- |
|
BENCHMARK MORTGAGE TRUST 19B9 A5 FIX 4.0156% 15-MAR-2052
|
1.26% | -- | -- |
|
BENCHMARK MORTGAGE TRUST 22B34 A5 FIX 3.786% 16-APR-2055
|
1.25% | -- | -- |
Fees & Availability
| Fees | |
| Actual 12B-1 Fee | -- |
| Actual Management Fee | 0.42% |
| Administration Fee | -- |
| Maximum Front Load | 0.40% |
| Maximum Deferred Load | -- |
| Maximum Redemption Fee | 0.40% |
| General Availability | |
| Available for Insurance Product | No |
| Available for RRSP | No |
| Purchase Details | |
| Open to New Investors |
|
| Minimum Initial Investment | 300.00M None |
| Minimum Subsequent Investment | 0.00 None |
Basic Info
| Investment Strategy | |
| The Fund seeks capital appreciation and current income. The Fund invests primarily in debt investments and is not restricted in its exposure to any debt investment regardless of credit rating. It may invest in debt investments issued by a wide range of private issuers and by federal, state, local, and non-US governments. |
| General | |
| Security Type | Mutual Fund |
| Equity Style | -- |
| Broad Asset Class | Taxable Bond |
| Broad Category | Alternative Strategies |
| Global Peer Group | Alternative Credit Focus |
| Peer Group | Alternative Credit Focus Funds |
| Global Macro | Alternative Bond |
| US Macro | Alternative Bond Funds |
| YCharts Categorization | -- |
| YCharts Benchmark | -- |
| Prospectus Objective | Alternative Credit Focus Funds |
| Fund Owner Firm Name | GMO |
| Broad Asset Class Benchmark Index | |
| ^BBUSATR | 100.0% |
Fundamentals
| General | |
| Distribution Yield | -- |
| Dividend Yield TTM (6-8-26) | 5.01% |
| 30-Day SEC Yield (7-30-21) | 2.68% |
| 7-Day SEC Yield | -- |
| Number of Holdings | 316 |
| Bond | |
| Yield to Maturity (2-28-26) | 4.44% |
| Effective Duration | 0.90 |
| Average Coupon | 8.56% |
| Calculated Average Quality | 2.411 |
| Effective Maturity | 13.02 |
| Nominal Maturity | 13.02 |
| Number of Bond Holdings | 249 |
As of February 28, 2026
Fund Details
Top Portfolio Holders
| Name | % Weight |
|---|---|
| Portfolio A | 5.00% |
| Portfolio B | 3.50% |
| Portfolio C | 2.25% |
Excel Add-In Codes
| Name: =YCI("M:GMODX", "name") |
| Broad Asset Class: =YCI("M:GMODX", "broad_asset_class") |
| Broad Category: =YCI("M:GMODX", "broad_category_group") |
| Prospectus Objective: =YCI("M:GMODX", "prospectus_objective") |
| To find the codes for any of our securities and financial metrics, see our Complete Excel Reference. |