

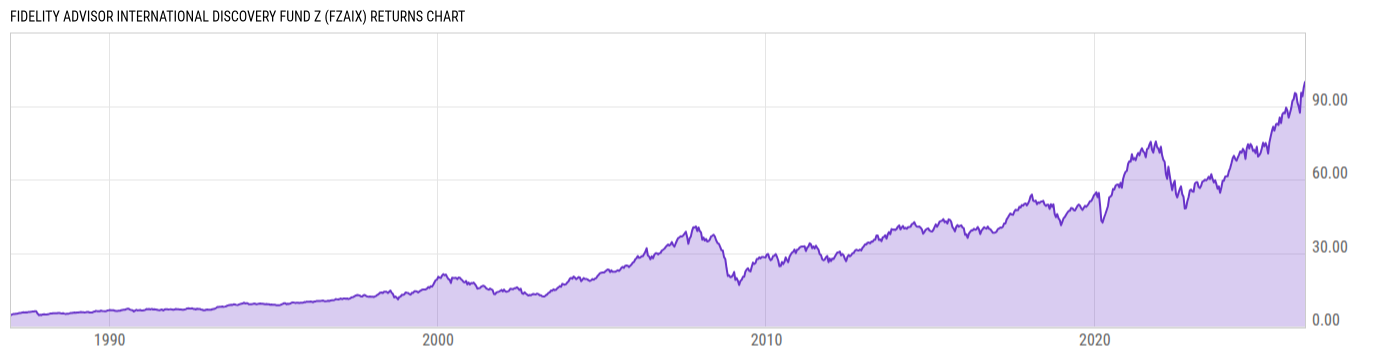
Fidelity Advisor International Discovery Fund Z (FZAIX)
63.61
+1.14
(+1.82%)
USD |
May 26 2026
Returns Chart
Key Stats
| Net Expense Ratio | Total Assets Under Management | Weighted Average Dividend Yield | Turnover Ratio (Generic) |
|---|---|---|---|
| 0.59% | 12.56B | 2.10% | 54.00% |
| 1 Year Fund Level Flows | 1 Year Total Returns (Daily) | Annualized Total Returns Since Inception (Daily) | Max Drawdown (Since Inception) |
| -337.79M | 25.18% |
Basic Info
| Investment Strategy | |
| The Fund seeks growth of capital and current income, consistent with reasonable investment risk. Invests at least 65% of assets in foreign securities. Focus is on common stocks paying current dividends and showing capital appreciation potential. May invest in debt securities, including those of lower-quality. |
| General | |
| Security Type | Mutual Fund |
| Equity Style | Large Cap Growth |
| Broad Asset Class | International Equity |
| Broad Category | Equity |
| Global Peer Group | Equity Global ex US |
| Peer Group | International Large-Cap Growth |
| Global Macro | Equity Global |
| US Macro | Developed International Markets Funds |
| YCharts Categorization | -- |
| YCharts Benchmark | -- |
| Prospectus Objective | International Funds |
| Fund Owner Firm Name | Fidelity Investments |
| Broad Asset Class Benchmark Index | |
| ^MSACXUSNTR | 100.0% |
Net Fund Flows Versus Peer Group
1 Month
% Rank:
81
-820.02M
Peer Group Low
428.42M
Peer Group High
1 Year
% Rank:
78
-337.79M
-23.62B
Peer Group Low
2.310B
Peer Group High
3 Months
% Rank:
67
-3.163B
Peer Group Low
5.097B
Peer Group High
3 Years
% Rank:
55
-54.46B
Peer Group Low
3.371B
Peer Group High
6 Months
% Rank:
80
-10.70B
Peer Group Low
4.813B
Peer Group High
5 Years
% Rank:
78
-79.53B
Peer Group Low
5.715B
Peer Group High
YTD
% Rank:
84
-5.129B
Peer Group Low
5.097B
Peer Group High
10 Years
% Rank:
91
-105.94B
Peer Group Low
8.807B
Peer Group High
Date Unavailable
Risk
Performance Versus Peer Group
Annual Total Returns Versus Peers
As of May 27, 2026.
Asset Allocation
As of March 31, 2026.
| Type | % Net |
|---|---|
| Cash | 0.96% |
| Stock | 93.94% |
| Bond | 2.43% |
| Convertible | 0.00% |
| Preferred | 0.58% |
| Other | 2.09% |
Top 10 Holdings
| Name | % Weight | Price | % Change |
|---|---|---|---|
| Taiwan Semiconductor Manufacturing Co., Ltd. | 4.11% | 17.24 | 0.00% |
|
Fidelity Cash Central Fund
|
4.08% | -- | -- |
| Zegona Communications Plc | 3.95% | 24.49 | 0.04% |
| ASML Holding NV | 3.27% | 1604.28 | -2.36% |
| Banco Santander SA | 2.54% | 12.48 | 3.01% |
| Investor AB | 2.36% | 41.09 | 0.20% |
| British American Tobacco plc | 2.35% | 63.22 | -2.35% |
|
Other Assets less Liabilities
|
2.09% | -- | -- |
| ITOCHU Corp. | 2.06% | 12.34 | 0.15% |
| Mitsubishi UFJ Financial Group, Inc. | 1.97% | 18.28 | -8.91% |
Fees & Availability
| Fees | |
| Actual 12B-1 Fee | -- |
| Actual Management Fee | 0.58% |
| Administration Fee | -- |
| Maximum Front Load | -- |
| Maximum Deferred Load | -- |
| Maximum Redemption Fee | 0.00% |
| General Availability | |
| Available for Insurance Product | No |
| Available for RRSP | No |
| Purchase Details | |
| Open to New Investors |
|
| Minimum Initial Investment | 0.00 None |
| Minimum Subsequent Investment | 0.00 None |
Basic Info
| Investment Strategy | |
| The Fund seeks growth of capital and current income, consistent with reasonable investment risk. Invests at least 65% of assets in foreign securities. Focus is on common stocks paying current dividends and showing capital appreciation potential. May invest in debt securities, including those of lower-quality. |
| General | |
| Security Type | Mutual Fund |
| Equity Style | Large Cap Growth |
| Broad Asset Class | International Equity |
| Broad Category | Equity |
| Global Peer Group | Equity Global ex US |
| Peer Group | International Large-Cap Growth |
| Global Macro | Equity Global |
| US Macro | Developed International Markets Funds |
| YCharts Categorization | -- |
| YCharts Benchmark | -- |
| Prospectus Objective | International Funds |
| Fund Owner Firm Name | Fidelity Investments |
| Broad Asset Class Benchmark Index | |
| ^MSACXUSNTR | 100.0% |
Fundamentals
| General | |
| Distribution Yield | -- |
| Dividend Yield TTM (5-22-26) | 2.87% |
| 30-Day SEC Yield (10-3-23) | 0.00% |
| 7-Day SEC Yield (10-3-23) | 0.00% |
| Number of Holdings | 141 |
| Stock | |
| Weighted Average PE Ratio | 25.66 |
| Weighted Average Price to Sales Ratio | 4.975 |
| Weighted Average Price to Book Ratio | 6.189 |
| Weighted Median ROE | 29.60% |
| Weighted Median ROA | 8.23% |
| ROI (TTM) | 14.83% |
| Return on Investment (TTM) | 14.83% |
| Earning Yield | 0.0548 |
| LT Debt / Shareholders Equity | 0.6235 |
| Number of Equity Holdings | 131 |
As of March 31, 2026
Growth Metrics
| EPS Growth (1Y) | 25.14% |
| EPS Growth (3Y) | 21.84% |
| EPS Growth (5Y) | 24.43% |
| Sales Growth (1Y) | 13.53% |
| Sales Growth (3Y) | 11.62% |
| Sales Growth (5Y) | 12.75% |
| Sales per Share Growth (1Y) | 15.99% |
| Sales per Share Growth (3Y) | 13.05% |
| Operating Cash Flow - Growth Rate (3Y) | 16.11% |
As of March 31, 2026
Fund Details
| Key Dates | |
| Inception Date | 8/13/2013 |
| Last Annual Report Date | 10/31/2025 |
| Last Prospectus Date | 12/30/2025 |
| Share Classes | |
| FAIDX | A |
| FCADX | C |
| FIADX | Inst |
| FIDKX | K |
| FIGRX | Direct Sold |
| FTADX | M |
| Attributes | |
| Index Fund | -- |
| Inverse Fund | No |
| Leveraged Fund | -- |
| Fund of Funds | No |
| Currency Hedged Fund | -- |
| Socially Responsible Fund | No |
Top Portfolio Holders
| Name | % Weight |
|---|---|
| Portfolio A | 5.00% |
| Portfolio B | 3.50% |
| Portfolio C | 2.25% |
Excel Add-In Codes
| Name: =YCI("M:FZAIX", "name") |
| Broad Asset Class: =YCI("M:FZAIX", "broad_asset_class") |
| Broad Category: =YCI("M:FZAIX", "broad_category_group") |
| Prospectus Objective: =YCI("M:FZAIX", "prospectus_objective") |
| To find the codes for any of our securities and financial metrics, see our Complete Excel Reference. |