

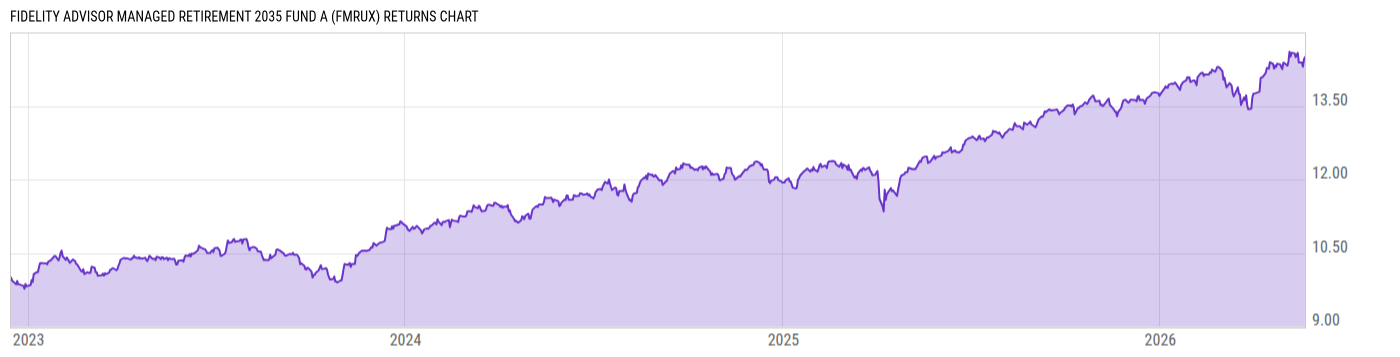
Fidelity Advisor Managed Retirement 2035 Fund A (FMRUX)
13.13
-0.08
(-0.61%)
USD |
May 19 2026
Returns Chart
Key Stats
| Net Expense Ratio | Total Assets Under Management | Weighted Average Dividend Yield | Turnover Ratio (Generic) |
|---|---|---|---|
| 0.73% | 14.55M | -- | 54.00% |
| 1 Year Fund Level Flows | 1 Year Total Returns (Daily) | Annualized Total Returns Since Inception (Daily) | Max Drawdown (Since Inception) |
| -7.717M | 14.67% |
Basic Info
| Investment Strategy | |
| The Fund seeks total return until its horizon date through a combination of current income and capital growth. Investing in a combination of Fidelity US equity funds, international equity funds, bond funds, and short-term funds in a manner that supports a withdrawal strategy to provide investors with income in retirement. |
| General | |
| Security Type | Mutual Fund |
| Equity Style | -- |
| Broad Asset Class | Allocation |
| Broad Category | Allocation |
| Global Peer Group | Mixed Asset USD Balanced - US |
| Peer Group | Retirement Income Funds |
| Global Macro | Mixed Asset HC Balanced |
| US Macro | Mixed-Assets Target Allocation Funds |
| YCharts Categorization | -- |
| YCharts Benchmark | -- |
| Prospectus Objective | Income Funds |
| Fund Owner Firm Name | Fidelity Investments |
| Broad Asset Class Benchmark Index | |
| ^SPXTR | 100.0% |
Net Fund Flows Versus Peer Group
1 Month
% Rank:
98
-11.98M
Peer Group Low
9.708M
Peer Group High
1 Year
% Rank:
70
-7.717M
-19.99M
Peer Group Low
81.72M
Peer Group High
3 Months
% Rank:
98
-12.64M
Peer Group Low
25.11M
Peer Group High
3 Years
% Rank:
5
-211.53M
Peer Group Low
14.97M
Peer Group High
6 Months
% Rank:
98
-13.61M
Peer Group Low
24.17M
Peer Group High
5 Years
% Rank:
20
-138.66M
Peer Group Low
183.20M
Peer Group High
YTD
% Rank:
98
-13.14M
Peer Group Low
29.29M
Peer Group High
10 Years
% Rank:
58
-51.29M
Peer Group Low
1.060B
Peer Group High
Date Unavailable
Risk
Performance Versus Peer Group
Annual Total Returns Versus Peers
As of May 20, 2026.
Asset Allocation
As of March 31, 2026.
| Type | % Net |
|---|---|
| Cash | 6.08% |
| Stock | 48.84% |
| Bond | 49.26% |
| Convertible | 0.00% |
| Preferred | 0.21% |
| Other | -4.39% |
Top 10 Holdings
| Name | % Weight | Price | % Change |
|---|---|---|---|
| Fidelity Series Government Bond Index Fund | 9.66% | 8.99 | -0.22% |
| Fidelity Series Investment Grade Bond Fund | 8.93% | 9.95 | -0.30% |
| Fidelity Series 5+ Year Inflation-Protected Bd Idx | 8.62% | 7.56 | -0.53% |
| Fidelity Series Large Cap Value Index Fund | 7.44% | 20.16 | -0.44% |
| Fidelity Series Emerging Markets Opportunities Fnd | 6.13% | 29.82 | -1.32% |
| Fidelity Series Blue Chip Growth Fund | 6.09% | 25.69 | -0.50% |
| Fidelity Series Corporate Bond Fund | 5.79% | 9.23 | -0.43% |
| Fidelity Series Investment Grade Securitized Fund | 5.43% | 8.95 | -0.33% |
| Fidelity Series International Developed Mkts Bd Id | 4.79% | 8.34 | -0.12% |
| Fidelity Series Large Cap Stock Fund | 4.07% | 28.74 | -0.52% |
Fees & Availability
| Fees | |
| Actual 12B-1 Fee | 0.25% |
| Actual Management Fee | 0.48% |
| Administration Fee | -- |
| Maximum Front Load | 5.75% |
| Maximum Deferred Load | -- |
| Maximum Redemption Fee | -- |
| General Availability | |
| Available for Insurance Product | No |
| Available for RRSP | No |
| Purchase Details | |
| Open to New Investors | No |
| Minimum Initial Investment | 0.00 None |
| Minimum Subsequent Investment | 0.00 None |
Basic Info
| Investment Strategy | |
| The Fund seeks total return until its horizon date through a combination of current income and capital growth. Investing in a combination of Fidelity US equity funds, international equity funds, bond funds, and short-term funds in a manner that supports a withdrawal strategy to provide investors with income in retirement. |
| General | |
| Security Type | Mutual Fund |
| Equity Style | -- |
| Broad Asset Class | Allocation |
| Broad Category | Allocation |
| Global Peer Group | Mixed Asset USD Balanced - US |
| Peer Group | Retirement Income Funds |
| Global Macro | Mixed Asset HC Balanced |
| US Macro | Mixed-Assets Target Allocation Funds |
| YCharts Categorization | -- |
| YCharts Benchmark | -- |
| Prospectus Objective | Income Funds |
| Fund Owner Firm Name | Fidelity Investments |
| Broad Asset Class Benchmark Index | |
| ^SPXTR | 100.0% |
Fundamentals
| General | |
| Distribution Yield | -- |
| Dividend Yield TTM (5-18-26) | 2.28% |
| 30-Day SEC Yield (10-3-23) | 0.00% |
| 7-Day SEC Yield (10-3-23) | 0.00% |
| Number of Holdings | 34 |
| Stock | |
| Weighted Average PE Ratio | 28.18 |
| Weighted Average Price to Sales Ratio | 6.395 |
| Weighted Average Price to Book Ratio | 7.713 |
| Weighted Median ROE | 51.86% |
| Weighted Median ROA | 12.33% |
| ROI (TTM) | 18.47% |
| Return on Investment (TTM) | 18.47% |
| Earning Yield | 0.0482 |
| LT Debt / Shareholders Equity | 0.7215 |
| Number of Equity Holdings | 0 |
| Bond | |
| Yield to Maturity (3-31-26) | 3.90% |
| Effective Duration | -- |
| Average Coupon | 3.30% |
| Calculated Average Quality | 2.248 |
| Effective Maturity | 12.48 |
| Nominal Maturity | 12.52 |
| Number of Bond Holdings | 0 |
As of March 31, 2026
Growth Metrics
| EPS Growth (1Y) | 26.85% |
| EPS Growth (3Y) | 17.79% |
| EPS Growth (5Y) | 23.56% |
| Sales Growth (1Y) | 13.78% |
| Sales Growth (3Y) | 12.30% |
| Sales Growth (5Y) | 13.89% |
| Sales per Share Growth (1Y) | 30.40% |
| Sales per Share Growth (3Y) | 13.03% |
| Operating Cash Flow - Growth Rate (3Y) | 20.65% |
As of March 31, 2026
Fund Details
Top Portfolio Holders
| Name | % Weight |
|---|---|
| Portfolio A | 5.00% |
| Portfolio B | 3.50% |
| Portfolio C | 2.25% |
Excel Add-In Codes
| Name: =YCI("M:FMRUX", "name") |
| Broad Asset Class: =YCI("M:FMRUX", "broad_asset_class") |
| Broad Category: =YCI("M:FMRUX", "broad_category_group") |
| Prospectus Objective: =YCI("M:FMRUX", "prospectus_objective") |
| To find the codes for any of our securities and financial metrics, see our Complete Excel Reference. |