

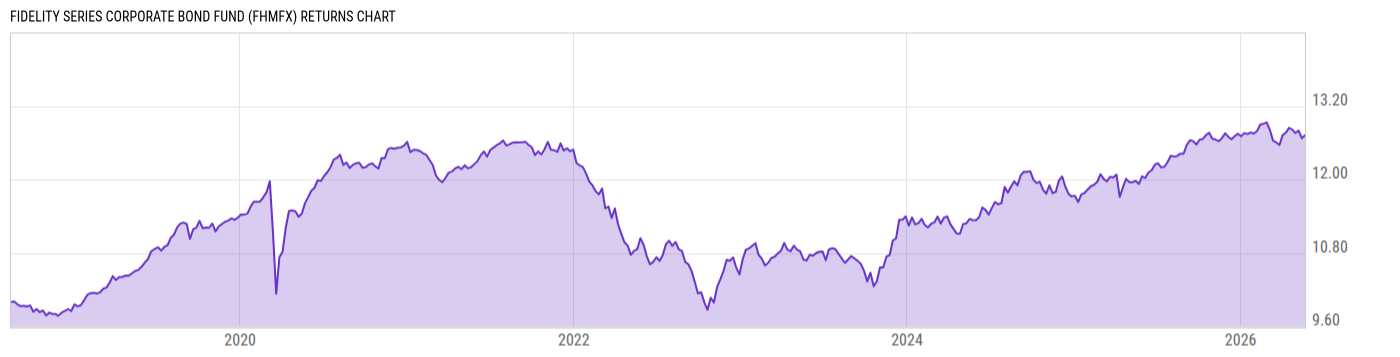
Fidelity Series Corporate Bond Fund (FHMFX)
9.31
+0.01
(+0.11%)
USD |
May 22 2026
Returns Chart
Key Stats
| Net Expense Ratio | Total Assets Under Management | Weighted Average Dividend Yield | Turnover Ratio (Generic) |
|---|---|---|---|
| 0.00% | 880.00M | -- | 39.00% |
| 1 Year Fund Level Flows | 1 Year Total Returns (Daily) | Annualized Total Returns Since Inception (Daily) | Max Drawdown (Since Inception) |
| 76.81M | 6.84% |
Basic Info
| Investment Strategy | |
| The Fund seeks a high level of current income. It invests at least 80% of the funds assets in investment-grade corporate bonds and other corporate debt securities and repurchase agreements for those securities and uses the Bloomberg Barclays US Credit Bond Index as a guide in structuring and selecting its investments. |
| General | |
| Security Type | Mutual Fund |
| Equity Style | -- |
| Broad Asset Class | Taxable Bond |
| Broad Category | Fixed Income |
| Global Peer Group | Bond USD Corporates |
| Peer Group | Corporate Debt Funds BBB-Rated |
| Global Macro | Bond Corporates |
| US Macro | General Domestic Taxable Fixed Income Funds |
| YCharts Categorization | -- |
| YCharts Benchmark | -- |
| Prospectus Objective | Corporate Debt Funds BBB-Rated |
| Fund Owner Firm Name | Fidelity Investments |
| Broad Asset Class Benchmark Index | |
| ^BBUSATR | 100.0% |
Net Fund Flows Versus Peer Group
1 Month
% Rank:
85
-1.147B
Peer Group Low
1.940B
Peer Group High
1 Year
% Rank:
32
76.81M
-4.685B
Peer Group Low
13.40B
Peer Group High
3 Months
% Rank:
32
-357.27M
Peer Group Low
3.527B
Peer Group High
3 Years
% Rank:
24
-8.057B
Peer Group Low
24.97B
Peer Group High
6 Months
% Rank:
37
-1.778B
Peer Group Low
9.539B
Peer Group High
5 Years
% Rank:
23
-9.856B
Peer Group Low
27.17B
Peer Group High
YTD
% Rank:
44
-451.42M
Peer Group Low
7.193B
Peer Group High
10 Years
% Rank:
30
-7.443B
Peer Group Low
63.14B
Peer Group High
Date Unavailable
Risk
Performance Versus Peer Group
Annual Total Returns Versus Peers
As of May 24, 2026.
Asset Allocation
As of March 31, 2026.
| Type | % Net |
|---|---|
| Cash | 0.93% |
| Stock | 0.00% |
| Bond | 98.32% |
| Convertible | 0.00% |
| Preferred | 0.00% |
| Other | 0.75% |
Top 10 Holdings
| Name | % Weight | Price | % Change |
|---|---|---|---|
|
Fidelity Cash Central Fund
|
2.30% | -- | -- |
| United States of America USGB 4.75 02/15/2056 FIX USD Government | 1.68% | 95.15 | 0.38% |
| United States of America USGB 4.625 11/15/2055 FIX USD Government | 1.58% | 93.20 | 0.35% |
| United States of America USGB 4.625 02/15/2046 FIX USD Government | 0.93% | 94.34 | 0.22% |
|
Other Assets less Liabilities
|
0.75% | -- | -- |
| KBC Group NV KBCG 4.932 10/16/2030 FLT USD Corporate 144A '29 | 0.71% | 100.13 | -0.10% |
| T-Mobile USA, Inc. DT-TMobileUS 4.95 11/15/2035 FIX USD Corporate | 0.65% | 97.31 | 0.09% |
| Morgan Stanley MWD 3.622 04/01/2031 FLT USD Corporate '30 | 0.64% | 95.66 | -0.08% |
| JPMorgan Chase & Co. JPM 4.946 10/22/2035 FLT USD Corporate '34 | 0.62% | 98.24 | 0.13% |
| Wells Fargo & Company WFC 5.557 07/25/2034 FLT USD Corporate '33 | 0.60% | 102.35 | 0.23% |
Fees & Availability
| Fees | |
| Actual 12B-1 Fee | -- |
| Actual Management Fee | 0.00% |
| Administration Fee | -- |
| Maximum Front Load | -- |
| Maximum Deferred Load | -- |
| Maximum Redemption Fee | -- |
| General Availability | |
| Available for Insurance Product | No |
| Available for RRSP | No |
| Purchase Details | |
| Open to New Investors |
|
| Minimum Initial Investment | 0.00 None |
| Minimum Subsequent Investment | 0.00 None |
Basic Info
| Investment Strategy | |
| The Fund seeks a high level of current income. It invests at least 80% of the funds assets in investment-grade corporate bonds and other corporate debt securities and repurchase agreements for those securities and uses the Bloomberg Barclays US Credit Bond Index as a guide in structuring and selecting its investments. |
| General | |
| Security Type | Mutual Fund |
| Equity Style | -- |
| Broad Asset Class | Taxable Bond |
| Broad Category | Fixed Income |
| Global Peer Group | Bond USD Corporates |
| Peer Group | Corporate Debt Funds BBB-Rated |
| Global Macro | Bond Corporates |
| US Macro | General Domestic Taxable Fixed Income Funds |
| YCharts Categorization | -- |
| YCharts Benchmark | -- |
| Prospectus Objective | Corporate Debt Funds BBB-Rated |
| Fund Owner Firm Name | Fidelity Investments |
| Broad Asset Class Benchmark Index | |
| ^BBUSATR | 100.0% |
Fundamentals
| General | |
| Distribution Yield | -- |
| Dividend Yield TTM (5-21-26) | 4.85% |
| 30-Day SEC Yield (4-30-26) | 5.24% |
| 7-Day SEC Yield | -- |
| Number of Holdings | 666 |
| Bond | |
| Yield to Maturity (3-31-26) | 5.33% |
| Effective Duration | 6.54 |
| Average Coupon | 4.98% |
| Calculated Average Quality | 3.609 |
| Effective Maturity | 10.85 |
| Nominal Maturity | 10.96 |
| Number of Bond Holdings | 615 |
As of March 31, 2026
Fund Details
| Key Dates | |
| Inception Date | 8/17/2018 |
| Last Annual Report Date | 8/31/2025 |
| Last Prospectus Date | 10/30/2025 |
| Attributes | |
| Index Fund | -- |
| Inverse Fund | No |
| Leveraged Fund | -- |
| Fund of Funds | No |
| Currency Hedged Fund | -- |
| Socially Responsible Fund | No |
Top Portfolio Holders
| Name | % Weight |
|---|---|
| Portfolio A | 5.00% |
| Portfolio B | 3.50% |
| Portfolio C | 2.25% |
Excel Add-In Codes
| Name: =YCI("M:FHMFX", "name") |
| Broad Asset Class: =YCI("M:FHMFX", "broad_asset_class") |
| Broad Category: =YCI("M:FHMFX", "broad_category_group") |
| Prospectus Objective: =YCI("M:FHMFX", "prospectus_objective") |
| To find the codes for any of our securities and financial metrics, see our Complete Excel Reference. |