

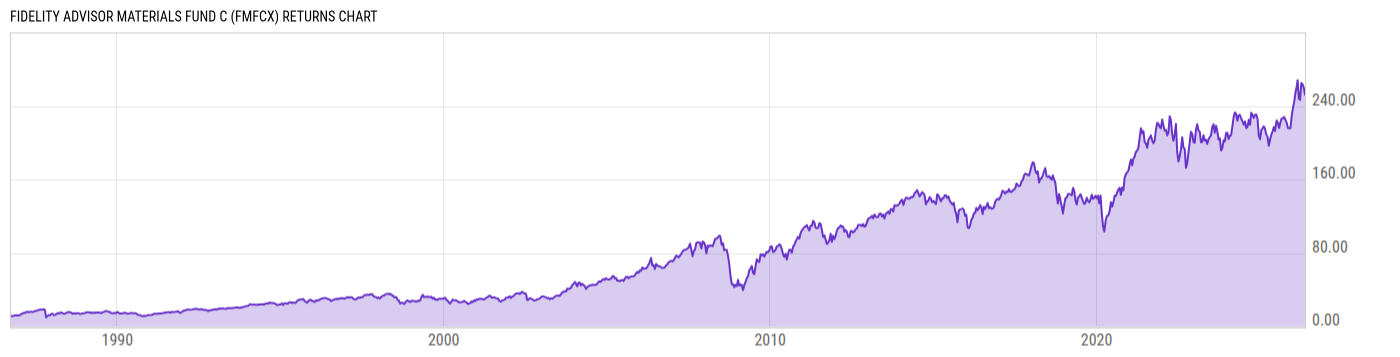
Fidelity Advisor Materials Fund C (FMFCX)
94.43
+1.13
(+1.21%)
USD |
Jun 09 2026
Returns Chart
Key Stats
| Net Expense Ratio | Total Assets Under Management | Weighted Average Dividend Yield | Turnover Ratio (Generic) |
|---|---|---|---|
| 1.74% | 833.90M | 1.35% | 56.00% |
| 1 Year Fund Level Flows | 1 Year Total Returns (Daily) | Annualized Total Returns Since Inception (Daily) | Max Drawdown (Since Inception) |
| -45.28M | 16.83% |
Basic Info
| Investment Strategy | |
| The Fund seeks capital appreciation. Fidelity normally invests in companies principally engaged in the manufacture, mining, processing, or distribution of raw materials and intermediate goods used in the industrial sector. These may include, for example, chemicals, metals, textiles, wood products, cement and gypsum. |
| General | |
| Security Type | Mutual Fund |
| Equity Style | Multi Cap Core |
| Broad Asset Class | Sector Equity |
| Broad Category | Equity |
| Global Peer Group | Equity Sector Materials |
| Peer Group | Basic Materials Funds |
| Global Macro | Equity Industry Sector |
| US Macro | Sector Equity Funds |
| YCharts Categorization | -- |
| YCharts Benchmark | -- |
| Prospectus Objective | Basic Materials Funds |
| Fund Owner Firm Name | Fidelity Investments |
| Broad Asset Class Benchmark Index | |
| ^MSWNTR | 100.0% |
Net Fund Flows Versus Peer Group
1 Month
% Rank:
26
-302.51M
Peer Group Low
155.24M
Peer Group High
1 Year
% Rank:
93
-45.28M
-53.43M
Peer Group Low
3.414B
Peer Group High
3 Months
% Rank:
24
-19.61M
Peer Group Low
381.25M
Peer Group High
3 Years
% Rank:
87
-1.147B
Peer Group Low
3.475B
Peer Group High
6 Months
% Rank:
57
-99.07M
Peer Group Low
2.830B
Peer Group High
5 Years
% Rank:
87
-3.185B
Peer Group Low
3.995B
Peer Group High
YTD
% Rank:
44
-69.10M
Peer Group Low
2.239B
Peer Group High
10 Years
% Rank:
93
-1.351B
Peer Group Low
5.027B
Peer Group High
Date Unavailable
Risk
Performance Versus Peer Group
Annual Total Returns Versus Peers
As of June 10, 2026.
Asset Allocation
As of April 30, 2026.
| Type | % Net |
|---|---|
| Cash | 0.08% |
| Stock | 99.74% |
| Bond | 0.15% |
| Convertible | 0.00% |
| Preferred | 0.00% |
| Other | 0.03% |
Top 10 Holdings
| Name | % Weight | Price | % Change |
|---|---|---|---|
| Linde Plc | 15.62% | 519.39 | 0.74% |
| Ecolab, Inc. | 6.30% | 261.73 | -1.02% |
| Newmont Corp. | 5.87% | 96.47 | -2.10% |
| Freeport-McMoRan, Inc. | 4.96% | 64.01 | -0.37% |
| CRH Plc | 4.57% | 103.62 | -0.08% |
| Nucor Corp. | 4.34% | 255.46 | 0.45% |
| Air Products & Chemicals, Inc. | 4.19% | 284.58 | 0.57% |
| Solstice Advanced Materials, Inc. | 3.97% | 80.12 | -0.21% |
| Corteva, Inc. | 3.95% | 74.93 | -0.11% |
| The Sherwin-Williams Co. | 3.15% | 308.68 | -0.60% |
Fees & Availability
| Fees | |
| Actual 12B-1 Fee | 1.00% |
| Actual Management Fee | 0.71% |
| Administration Fee | -- |
| Maximum Front Load | -- |
| Maximum Deferred Load | 1.00% |
| Maximum Redemption Fee | 0.00% |
| General Availability | |
| Available for Insurance Product | No |
| Available for RRSP | No |
| Purchase Details | |
| Open to New Investors |
|
| Minimum Initial Investment | 0.00 None |
| Minimum Subsequent Investment | 0.00 None |
Basic Info
| Investment Strategy | |
| The Fund seeks capital appreciation. Fidelity normally invests in companies principally engaged in the manufacture, mining, processing, or distribution of raw materials and intermediate goods used in the industrial sector. These may include, for example, chemicals, metals, textiles, wood products, cement and gypsum. |
| General | |
| Security Type | Mutual Fund |
| Equity Style | Multi Cap Core |
| Broad Asset Class | Sector Equity |
| Broad Category | Equity |
| Global Peer Group | Equity Sector Materials |
| Peer Group | Basic Materials Funds |
| Global Macro | Equity Industry Sector |
| US Macro | Sector Equity Funds |
| YCharts Categorization | -- |
| YCharts Benchmark | -- |
| Prospectus Objective | Basic Materials Funds |
| Fund Owner Firm Name | Fidelity Investments |
| Broad Asset Class Benchmark Index | |
| ^MSWNTR | 100.0% |
Fundamentals
| General | |
| Distribution Yield | -- |
| Dividend Yield TTM (6-8-26) | 0.36% |
| 30-Day SEC Yield (10-3-23) | 0.00% |
| 7-Day SEC Yield (10-3-23) | 0.00% |
| Number of Holdings | 56 |
| Stock | |
| Weighted Average PE Ratio | 30.76 |
| Weighted Average Price to Sales Ratio | 5.542 |
| Weighted Average Price to Book Ratio | 4.705 |
| Weighted Median ROE | 13.13% |
| Weighted Median ROA | 6.89% |
| ROI (TTM) | 8.11% |
| Return on Investment (TTM) | 8.11% |
| Earning Yield | 0.0392 |
| LT Debt / Shareholders Equity | 0.8842 |
| Number of Equity Holdings | 54 |
As of April 30, 2026
Growth Metrics
| EPS Growth (1Y) | 11.70% |
| EPS Growth (3Y) | 1.90% |
| EPS Growth (5Y) | 17.81% |
| Sales Growth (1Y) | 7.86% |
| Sales Growth (3Y) | 2.19% |
| Sales Growth (5Y) | 7.88% |
| Sales per Share Growth (1Y) | 7.40% |
| Sales per Share Growth (3Y) | 1.47% |
| Operating Cash Flow - Growth Rate (3Y) | 7.20% |
As of April 30, 2026
Fund Details
Top Portfolio Holders
| Name | % Weight |
|---|---|
| Portfolio A | 5.00% |
| Portfolio B | 3.50% |
| Portfolio C | 2.25% |
Excel Add-In Codes
| Name: =YCI("M:FMFCX", "name") |
| Broad Asset Class: =YCI("M:FMFCX", "broad_asset_class") |
| Broad Category: =YCI("M:FMFCX", "broad_category_group") |
| Prospectus Objective: =YCI("M:FMFCX", "prospectus_objective") |
| To find the codes for any of our securities and financial metrics, see our Complete Excel Reference. |