

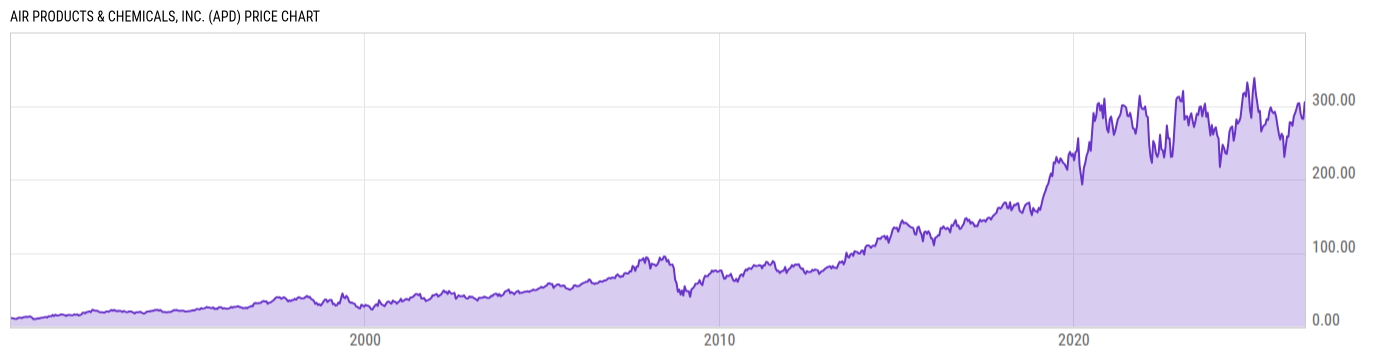
Air Products & Chemicals, Inc. (APD)
299.53
+3.68
(+1.24%)
USD |
NYSE |
Jul 10, 16:00
297.72
-1.81
(-0.60%)
After-Hours: 20:00
Price Chart
Key Stats
| Price and Performance | |
|---|---|
| Market Cap | 66.70B |
| 52 Week High (Daily) | |
| 52 Week Low (Daily) | |
| All-Time High (Daily) | |
| Year to Date Total Returns (Daily) | |
| 1 Month Total Returns (Daily) | |
| 1 Year Total Returns (Daily) | 4.52% |
| Valuation | |
| PE Ratio | 31.68 |
| PE Ratio (Forward) | |
| PS Ratio | 5.357 |
| Price to Book Value | 4.262 |
| EV to EBITDA | |
| Dividend | |
|---|---|
| Dividend | 1.81 |
| Dividend Yield (Forward) | |
| Financials | |
| Revenue (5 Year Growth) | |
| Revenue (Quarterly YoY Growth) | |
| EPS Diluted (5 Year Growth) | |
| EPS Diluted (Quarterly YoY Growth) | |
| Debt to Equity Ratio | 1.173 |
| Return on Equity | |
| Return on Assets | |
| Risk | |
| Beta (5Y) | |
| Max Drawdown (5Y) | 31.79% |
Profile
| Air Products & Chemicals, Inc. engages in the manufacture and distribution of atmospheric gases. It operates through the following segments: Americas, Asia, Europe, Middle East and India, and Corporate and Other. The Americas, Asia, Europe, and Middle East and India segments focuses on producing and selling gases to customers, including those in refining, chemicals, metals, electronics, manufacturing, medical, and food industries. The Corporate and Other segment is involved in sales of cryogenic and gas processing equipment for air separation that is sold worldwide to customers in a variety of industries, including chemical and petrochemical manufacturing, oil and gas recovery and processing, and steel and primary metals processing. The company was founded by Leonard Parker Pool on September 30, 1940 and is headquartered in Allentown, PA. |
| URL | http://www.airproducts.com |
| Investor Relations URL | https://investors.airproducts.com/ |
| HQ State/Province | Pennsylvania |
| Sector | Materials |
| Industry | Chemicals |
| Equity Style | Mid Cap Core |
| Next Earnings Release | Jul. 30, 2026 (est.) |
| Last Earnings Release | Apr. 30, 2026 |
| Next Ex-Dividend Date | N/A |
| Last Ex-Dividend Date | Jul. 01, 2026 |