

Victory Pioneer Equity Premium Income Fund R6 (FLEKX)
12.89
+0.04
(+0.31%)
USD |
Jun 09 2026
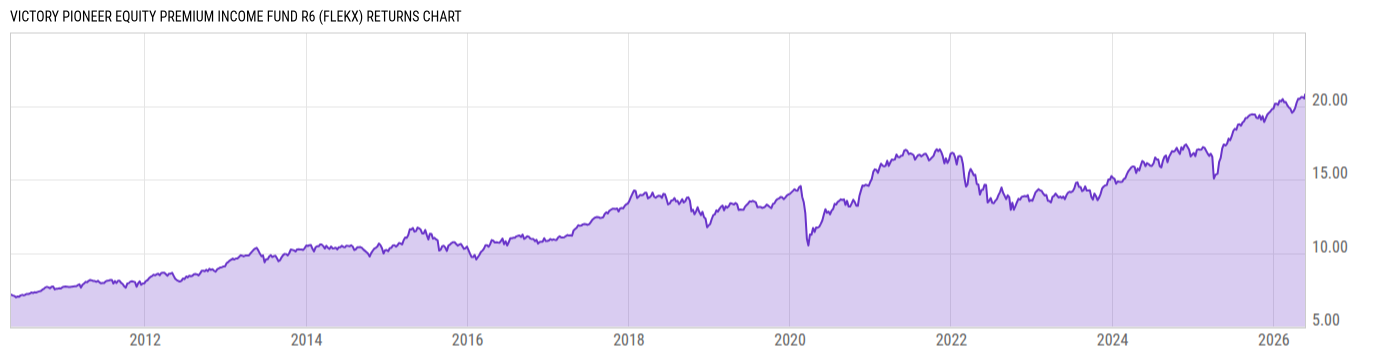
Returns Chart
Key Stats
| Net Expense Ratio | Total Assets Under Management | Weighted Average Dividend Yield | Turnover Ratio (Generic) |
|---|---|---|---|
| 0.90% | 160.83M | -- | 65.00% |
| 1 Year Fund Level Flows | 1 Year Total Returns (Daily) | Annualized Total Returns Since Inception (Daily) | Max Drawdown (Since Inception) |
| 22.85M | 17.03% |
Basic Info
| Investment Strategy | |
| The Fund seeks total return, including high current income. The fund invests its assets in equity securities and equity-related investment including common and preferred stocks, depositary receipts, warrants, rights, ELNs and other equity-linked securities, MLP, equity interests in REITs and other equity interests. |
| General | |
| Security Type | Mutual Fund |
| Equity Style | -- |
| Broad Asset Class | Alternative |
| Broad Category | Alternative Strategies |
| Global Peer Group | Alternative Global Macro |
| Peer Group | Alternative Global Macro Funds |
| Global Macro | Liquid Alternatives |
| US Macro | Alternative Equity Funds |
| YCharts Categorization | -- |
| YCharts Benchmark | -- |
| Prospectus Objective | Alternative Global Macro Funds |
| Fund Owner Firm Name | Victory Funds |
| Broad Asset Class Benchmark Index | |
| ^MSACWINTR | 100.0% |
Net Fund Flows Versus Peer Group
1 Month
% Rank:
29
-32.29M
Peer Group Low
445.62M
Peer Group High
1 Year
% Rank:
31
22.85M
-2.362B
Peer Group Low
2.464B
Peer Group High
3 Months
% Rank:
22
-65.51M
Peer Group Low
885.16M
Peer Group High
3 Years
% Rank:
55
-6.710B
Peer Group Low
3.190B
Peer Group High
6 Months
% Rank:
31
-289.08M
Peer Group Low
1.556B
Peer Group High
5 Years
% Rank:
66
-8.867B
Peer Group Low
3.112B
Peer Group High
YTD
% Rank:
27
-129.84M
Peer Group Low
1.443B
Peer Group High
10 Years
% Rank:
67
-17.87B
Peer Group Low
3.792B
Peer Group High
Date Unavailable
Risk
Performance Versus Peer Group
Annual Total Returns Versus Peers
As of June 10, 2026.
Asset Allocation
As of January 31, 2026.
| Type | % Net |
|---|---|
| Cash | 0.00% |
| Stock | 47.55% |
| Bond | 42.02% |
| Convertible | 0.00% |
| Preferred | 0.03% |
| Other | 10.40% |
Top 10 Holdings
| Name | % Weight | Price | % Change |
|---|---|---|---|
| DBS Group Holdings Ltd. | 2.15% | 51.05 | 0.87% |
| International Business Machines Corp. | 1.97% | 277.49 | -1.19% |
| Morgan Stanley | 1.94% | 210.25 | -0.94% |
| State Street Corp. | 1.86% | 163.25 | 0.89% |
| ASR Nederland NV | 1.82% | 71.46 | 0.00% |
| Citizens Financial Group, Inc. (Rhode Island) | 1.80% | 65.67 | 2.05% |
| Aviva Plc | 1.75% | 8.172 | 0.00% |
| FirstEnergy Corp. | 1.67% | 45.91 | 0.44% |
| Dominion Energy, Inc. | 1.65% | 66.25 | 1.11% |
| Sino Land Co. Ltd. | 1.64% | 1.32 | 0.00% |
Fees & Availability
| Fees | |
| Actual 12B-1 Fee | -- |
| Actual Management Fee | 0.55% |
| Administration Fee | 7.81K% |
| Maximum Front Load | -- |
| Maximum Deferred Load | -- |
| Maximum Redemption Fee | -- |
| General Availability | |
| Available for Insurance Product | No |
| Available for RRSP | No |
| Purchase Details | |
| Open to New Investors | No |
| Minimum Initial Investment | 5.00M None |
| Minimum Subsequent Investment | 0.00 None |
Basic Info
| Investment Strategy | |
| The Fund seeks total return, including high current income. The fund invests its assets in equity securities and equity-related investment including common and preferred stocks, depositary receipts, warrants, rights, ELNs and other equity-linked securities, MLP, equity interests in REITs and other equity interests. |
| General | |
| Security Type | Mutual Fund |
| Equity Style | -- |
| Broad Asset Class | Alternative |
| Broad Category | Alternative Strategies |
| Global Peer Group | Alternative Global Macro |
| Peer Group | Alternative Global Macro Funds |
| Global Macro | Liquid Alternatives |
| US Macro | Alternative Equity Funds |
| YCharts Categorization | -- |
| YCharts Benchmark | -- |
| Prospectus Objective | Alternative Global Macro Funds |
| Fund Owner Firm Name | Victory Funds |
| Broad Asset Class Benchmark Index | |
| ^MSACWINTR | 100.0% |
Fundamentals
| General | |
| Distribution Yield | -- |
| Dividend Yield TTM (6-8-26) | 10.51% |
| 30-Day SEC Yield (4-30-26) | 11.61% |
| 7-Day SEC Yield | -- |
| Number of Holdings | 147 |
| Stock | |
| Weighted Average PE Ratio | 20.12 |
| Weighted Average Price to Sales Ratio | 3.120 |
| Weighted Average Price to Book Ratio | 2.211 |
| Weighted Median ROE | 13.50% |
| Weighted Median ROA | 4.17% |
| ROI (TTM) | 9.57% |
| Return on Investment (TTM) | 9.57% |
| Earning Yield | 0.0650 |
| LT Debt / Shareholders Equity | 1.268 |
| Number of Equity Holdings | 44 |
| Bond | |
| Yield to Maturity (1-31-26) | 10.00% |
| Effective Duration | -- |
| Average Coupon | 17.79% |
| Calculated Average Quality | 5.00 |
| Effective Maturity | 0.5161 |
| Nominal Maturity | 0.5161 |
| Number of Bond Holdings | 72 |
As of January 31, 2026
Growth Metrics
| EPS Growth (1Y) | 18.82% |
| EPS Growth (3Y) | 5.14% |
| EPS Growth (5Y) | 4.36% |
| Sales Growth (1Y) | 8.30% |
| Sales Growth (3Y) | 7.10% |
| Sales Growth (5Y) | 5.80% |
| Sales per Share Growth (1Y) | 6.41% |
| Sales per Share Growth (3Y) | 7.22% |
| Operating Cash Flow - Growth Rate (3Y) | 5.05% |
As of January 31, 2026
Top Portfolio Holders
| Name | % Weight |
|---|---|
| Portfolio A | 5.00% |
| Portfolio B | 3.50% |
| Portfolio C | 2.25% |
Excel Add-In Codes
| Name: =YCI("M:FLEKX", "name") |
| Broad Asset Class: =YCI("M:FLEKX", "broad_asset_class") |
| Broad Category: =YCI("M:FLEKX", "broad_category_group") |
| Prospectus Objective: =YCI("M:FLEKX", "prospectus_objective") |
| To find the codes for any of our securities and financial metrics, see our Complete Excel Reference. |