

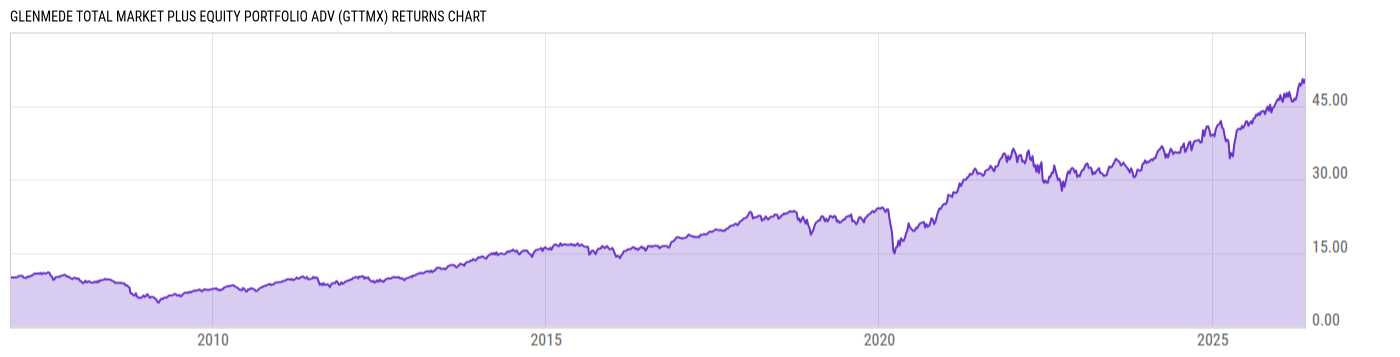
Glenmede Total Market Plus Equity Portfolio Adv (GTTMX)
20.24
+0.09
(+0.45%)
USD |
Jun 09 2026
Returns Chart
Key Stats
| Net Expense Ratio | Total Assets Under Management | Weighted Average Dividend Yield | Turnover Ratio (Generic) |
|---|---|---|---|
| 1.69% | 24.52M | -- | 69.00% |
| 1 Year Fund Level Flows | 1 Year Total Returns (Daily) | Annualized Total Returns Since Inception (Daily) | Max Drawdown (Since Inception) |
| -12.63M | 25.86% |
Basic Info
| Investment Strategy | |
| The Fund seeks long-term capital appreciation consistent with reasonable risk to principal. Using factor-based analysis, the Portfolio invests at least 80% of the value of its net assets in long and short positions with respect to equity securities, such as common stocks, of public companies tied economically to the US. |
| General | |
| Security Type | Mutual Fund |
| Equity Style | -- |
| Broad Asset Class | Alternative |
| Broad Category | Alternative Strategies |
| Global Peer Group | Alternative Long/Short Equity US |
| Peer Group | Alternative Active Extension Funds |
| Global Macro | Alternative Equity |
| US Macro | Alternative Equity Funds |
| YCharts Categorization | -- |
| YCharts Benchmark | -- |
| Prospectus Objective | Alternative Long/Short Equity Funds |
| Fund Owner Firm Name | Glenmede Funds |
| Broad Asset Class Benchmark Index | |
| ^MSACWINTR | 100.0% |
Net Fund Flows Versus Peer Group
1 Month
% Rank:
39
-59.78M
Peer Group Low
85.65M
Peer Group High
1 Year
% Rank:
54
-12.63M
-170.02M
Peer Group Low
301.10M
Peer Group High
3 Months
% Rank:
33
-115.73M
Peer Group Low
198.05M
Peer Group High
3 Years
% Rank:
91
-164.06M
Peer Group Low
903.16M
Peer Group High
6 Months
% Rank:
45
-142.32M
Peer Group Low
267.80M
Peer Group High
5 Years
% Rank:
54
-432.22M
Peer Group Low
735.42M
Peer Group High
YTD
% Rank:
45
-109.27M
Peer Group Low
253.94M
Peer Group High
10 Years
% Rank:
54
-12.87B
Peer Group Low
735.42M
Peer Group High
Date Unavailable
Risk
Performance Versus Peer Group
Annual Total Returns Versus Peers
As of June 11, 2026.
Asset Allocation
As of January 31, 2026.
| Type | % Net |
|---|---|
| Cash | 0.24% |
| Stock | 99.84% |
| Bond | 0.00% |
| Convertible | 0.00% |
| Preferred | 0.00% |
| Other | -0.08% |
Top 10 Holdings
| Name | % Weight | Price | % Change |
|---|---|---|---|
| Lam Research Corp. | 3.95% | 321.89 | -1.61% |
| KLA Corp. | 2.61% | 2139.68 | 0.01% |
| Applied Materials, Inc. | 2.61% | 497.15 | -0.41% |
| Catalyst Pharmaceuticals, Inc. | 2.58% | 31.35 | 0.03% |
| EMCOR Group, Inc. | 2.57% | 776.52 | -6.19% |
| Commercial Metals Co. | 2.57% | 73.70 | -2.72% |
| Baker Hughes Co. | 2.56% | 63.04 | -0.80% |
| Alphabet, Inc. | 2.54% | 356.50 | -2.13% |
| Fox Corp. | 2.51% | 67.98 | -0.49% |
| eBay, Inc. | 2.50% | 106.36 | -2.12% |
Fees & Availability
| Fees | |
| Actual 12B-1 Fee | -- |
| Actual Management Fee | 0.38% |
| Administration Fee | 33.93K% |
| Maximum Front Load | -- |
| Maximum Deferred Load | -- |
| Maximum Redemption Fee | -- |
| General Availability | |
| Available for Insurance Product | No |
| Available for RRSP | No |
| Purchase Details | |
| Open to New Investors |
|
| Minimum Initial Investment | 1000.00 None |
| Minimum Subsequent Investment | 0.00 None |
Basic Info
| Investment Strategy | |
| The Fund seeks long-term capital appreciation consistent with reasonable risk to principal. Using factor-based analysis, the Portfolio invests at least 80% of the value of its net assets in long and short positions with respect to equity securities, such as common stocks, of public companies tied economically to the US. |
| General | |
| Security Type | Mutual Fund |
| Equity Style | -- |
| Broad Asset Class | Alternative |
| Broad Category | Alternative Strategies |
| Global Peer Group | Alternative Long/Short Equity US |
| Peer Group | Alternative Active Extension Funds |
| Global Macro | Alternative Equity |
| US Macro | Alternative Equity Funds |
| YCharts Categorization | -- |
| YCharts Benchmark | -- |
| Prospectus Objective | Alternative Long/Short Equity Funds |
| Fund Owner Firm Name | Glenmede Funds |
| Broad Asset Class Benchmark Index | |
| ^MSACWINTR | 100.0% |
Fundamentals
| General | |
| Distribution Yield | -- |
| Dividend Yield TTM (6-8-26) | 0.31% |
| 30-Day SEC Yield | -- |
| 7-Day SEC Yield | -- |
| Number of Holdings | 10 |
| Stock | |
| Weighted Average PE Ratio | 25.75 |
| Weighted Average Price to Sales Ratio | 3.768 |
| Weighted Average Price to Book Ratio | 5.578 |
| Weighted Median ROE | 23.63% |
| Weighted Median ROA | 9.33% |
| ROI (TTM) | 13.86% |
| Return on Investment (TTM) | 13.86% |
| Earning Yield | 0.0510 |
| LT Debt / Shareholders Equity | 0.6811 |
| Number of Equity Holdings | 10 |
As of January 31, 2026
Growth Metrics
| EPS Growth (1Y) | 18.83% |
| EPS Growth (3Y) | 10.44% |
| EPS Growth (5Y) | 17.63% |
| Sales Growth (1Y) | 8.01% |
| Sales Growth (3Y) | 8.16% |
| Sales Growth (5Y) | 10.13% |
| Sales per Share Growth (1Y) | 9.89% |
| Sales per Share Growth (3Y) | 9.93% |
| Operating Cash Flow - Growth Rate (3Y) | 15.44% |
As of January 31, 2026
Fund Details
| Key Dates | |
| Inception Date | 12/21/2006 |
| Last Annual Report Date | 10/31/2025 |
| Last Prospectus Date | 2/28/2026 |
| Share Classes | |
| GTTLX | Inst |
| Attributes | |
| Index Fund | -- |
| Inverse Fund | No |
| Leveraged Fund | -- |
| Fund of Funds | No |
| Currency Hedged Fund | -- |
| Socially Responsible Fund | No |
Top Portfolio Holders
| Name | % Weight |
|---|---|
| Portfolio A | 5.00% |
| Portfolio B | 3.50% |
| Portfolio C | 2.25% |
Excel Add-In Codes
| Name: =YCI("M:GTTMX", "name") |
| Broad Asset Class: =YCI("M:GTTMX", "broad_asset_class") |
| Broad Category: =YCI("M:GTTMX", "broad_category_group") |
| Prospectus Objective: =YCI("M:GTTMX", "prospectus_objective") |
| To find the codes for any of our securities and financial metrics, see our Complete Excel Reference. |