

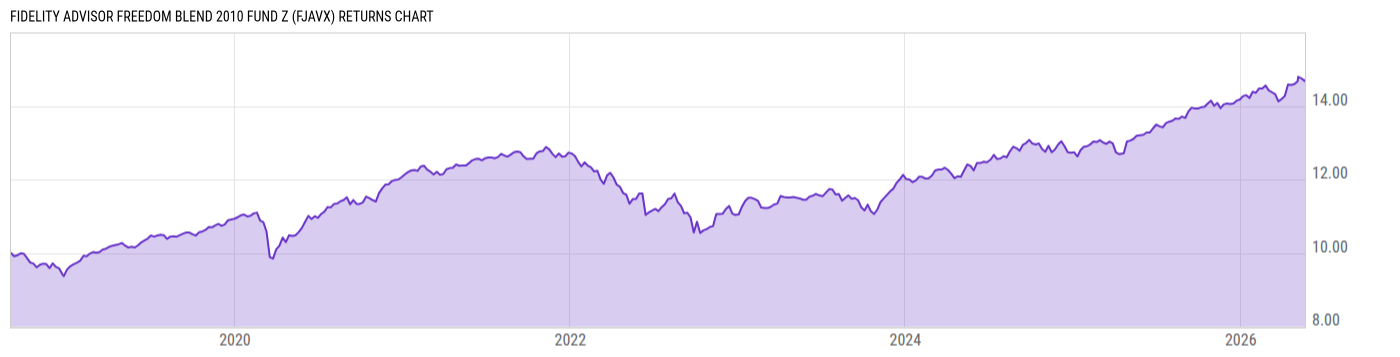
Fidelity Advisor Freedom Blend 2010 Fund Z (FJAVX)
11.22
+0.02
(+0.18%)
USD |
Jun 09 2026
Returns Chart
Key Stats
| Net Expense Ratio | Total Assets Under Management | Weighted Average Dividend Yield | Turnover Ratio (Generic) |
|---|---|---|---|
| 0.31% | 199.65M | -- | 35.00% |
| 1 Year Fund Level Flows | 1 Year Total Returns (Daily) | Annualized Total Returns Since Inception (Daily) | Max Drawdown (Since Inception) |
| 26.85M | 10.94% |
Basic Info
| Investment Strategy | |
| The Fund seeks high current income and, as a secondary objective, capital appreciation. Allocating assets according to a neutral asset allocation strategy that adjusts over time until it reaches an allocation similar to that of the Fidelity Freedom Blend Income Fund, approximately 10 to 19 years after the year 2010. |
| General | |
| Security Type | Mutual Fund |
| Equity Style | -- |
| Broad Asset Class | Allocation |
| Broad Category | Allocation |
| Global Peer Group | Target Maturity MA USD 2010 |
| Peer Group | Mixed-Asset Target 2010 Funds |
| Global Macro | Target Maturity |
| US Macro | Mixed-Assets Target Date Funds |
| YCharts Categorization | -- |
| YCharts Benchmark | -- |
| Prospectus Objective | Income Funds |
| Fund Owner Firm Name | Fidelity Investments |
| Broad Asset Class Benchmark Index | |
| ^SPXTR | 100.0% |
Net Fund Flows Versus Peer Group
1 Month
% Rank:
54
-36.26M
Peer Group Low
15.42M
Peer Group High
1 Year
% Rank:
11
26.85M
-506.96M
Peer Group Low
35.22M
Peer Group High
3 Months
% Rank:
6
-116.79M
Peer Group Low
35.74M
Peer Group High
3 Years
% Rank:
8
-1.626B
Peer Group Low
96.94M
Peer Group High
6 Months
% Rank:
6
-241.04M
Peer Group Low
28.52M
Peer Group High
5 Years
% Rank:
11
-3.015B
Peer Group Low
213.72M
Peer Group High
YTD
% Rank:
6
-176.05M
Peer Group Low
28.82M
Peer Group High
10 Years
% Rank:
8
-6.306B
Peer Group Low
385.61M
Peer Group High
Date Unavailable
Risk
Performance Versus Peer Group
Annual Total Returns Versus Peers
As of June 10, 2026.
Asset Allocation
As of April 30, 2026.
| Type | % Net |
|---|---|
| Cash | 6.55% |
| Stock | 33.37% |
| Bond | 63.94% |
| Convertible | 0.00% |
| Preferred | 0.15% |
| Other | -4.01% |
Top 10 Holdings
| Name | % Weight | Price | % Change |
|---|---|---|---|
| Fidelity Series 0-5 Year Inflation-Protected Bd Id | 17.31% | 10.02 | 0.10% |
| Fidelity Series Government Bond Index Fund | 10.07% | 9.05 | 0.22% |
| Fidelity Series Investment Grade Bond Fund | 9.31% | 10.03 | 0.20% |
| Fidelity Series Corporate Bond Fund | 6.03% | 9.32 | 0.22% |
| Fidelity Series Investment Grade Securitized Fund | 5.63% | 9.03 | 0.22% |
| Fidelity Series Large Cap Value Index Fund | 4.83% | 20.74 | 0.39% |
| Fidelity Series International Developed Mkts Bd Id | 4.66% | 8.44 | 0.12% |
| Fidelity Series Emerging Markets Opportunities Fnd | 4.62% | 30.55 | 0.79% |
| Fidelity Series Blue Chip Growth Fund | 4.29% | 26.27 | -0.94% |
|
10YR UL TN JUN26
|
3.90% | -- | -- |
Fees & Availability
| Fees | |
| Actual 12B-1 Fee | -- |
| Actual Management Fee | 0.31% |
| Administration Fee | -- |
| Maximum Front Load | -- |
| Maximum Deferred Load | -- |
| Maximum Redemption Fee | -- |
| General Availability | |
| Available for Insurance Product | No |
| Available for RRSP | No |
| Purchase Details | |
| Open to New Investors |
|
| Minimum Initial Investment | 0.00 None |
| Minimum Subsequent Investment | 0.00 None |
Basic Info
| Investment Strategy | |
| The Fund seeks high current income and, as a secondary objective, capital appreciation. Allocating assets according to a neutral asset allocation strategy that adjusts over time until it reaches an allocation similar to that of the Fidelity Freedom Blend Income Fund, approximately 10 to 19 years after the year 2010. |
| General | |
| Security Type | Mutual Fund |
| Equity Style | -- |
| Broad Asset Class | Allocation |
| Broad Category | Allocation |
| Global Peer Group | Target Maturity MA USD 2010 |
| Peer Group | Mixed-Asset Target 2010 Funds |
| Global Macro | Target Maturity |
| US Macro | Mixed-Assets Target Date Funds |
| YCharts Categorization | -- |
| YCharts Benchmark | -- |
| Prospectus Objective | Income Funds |
| Fund Owner Firm Name | Fidelity Investments |
| Broad Asset Class Benchmark Index | |
| ^SPXTR | 100.0% |
Fundamentals
| General | |
| Distribution Yield | -- |
| Dividend Yield TTM (6-8-26) | 2.92% |
| 30-Day SEC Yield (10-3-23) | 0.00% |
| 7-Day SEC Yield (10-3-23) | 0.00% |
| Number of Holdings | 48 |
| Stock | |
| Weighted Average PE Ratio | 28.28 |
| Weighted Average Price to Sales Ratio | 6.567 |
| Weighted Average Price to Book Ratio | 7.806 |
| Weighted Median ROE | 50.91% |
| Weighted Median ROA | 12.64% |
| ROI (TTM) | 18.84% |
| Return on Investment (TTM) | 18.84% |
| Earning Yield | 0.0482 |
| LT Debt / Shareholders Equity | 0.6998 |
| Number of Equity Holdings | 0 |
| Bond | |
| Yield to Maturity (4-30-26) | 3.33% |
| Effective Duration | -- |
| Average Coupon | 2.98% |
| Calculated Average Quality | 2.254 |
| Effective Maturity | 9.124 |
| Nominal Maturity | 9.159 |
| Number of Bond Holdings | 8 |
As of April 30, 2026
Growth Metrics
| EPS Growth (1Y) | 27.52% |
| EPS Growth (3Y) | 18.12% |
| EPS Growth (5Y) | 23.86% |
| Sales Growth (1Y) | 14.31% |
| Sales Growth (3Y) | 12.75% |
| Sales Growth (5Y) | 14.34% |
| Sales per Share Growth (1Y) | 31.63% |
| Sales per Share Growth (3Y) | 13.33% |
| Operating Cash Flow - Growth Rate (3Y) | 21.01% |
As of April 30, 2026
Fund Details
| Key Dates | |
| Inception Date | 8/31/2018 |
| Last Annual Report Date | 3/31/2025 |
| Last Prospectus Date | 5/30/2026 |
| Share Classes | |
| FFBHX | Premier |
| FHABX | A |
| FHAYX | Direct Sold |
| FHFEX | K |
| FHPDX | Other |
| FJAWX | Inst |
| FJAYX | C |
| FJAZX | M |
| Attributes | |
| Index Fund | -- |
| Inverse Fund | No |
| Leveraged Fund | -- |
| Fund of Funds |
|
| Currency Hedged Fund | -- |
| Socially Responsible Fund | No |
Top Portfolio Holders
| Name | % Weight |
|---|---|
| Portfolio A | 5.00% |
| Portfolio B | 3.50% |
| Portfolio C | 2.25% |
Excel Add-In Codes
| Name: =YCI("M:FJAVX", "name") |
| Broad Asset Class: =YCI("M:FJAVX", "broad_asset_class") |
| Broad Category: =YCI("M:FJAVX", "broad_category_group") |
| Prospectus Objective: =YCI("M:FJAVX", "prospectus_objective") |
| To find the codes for any of our securities and financial metrics, see our Complete Excel Reference. |