

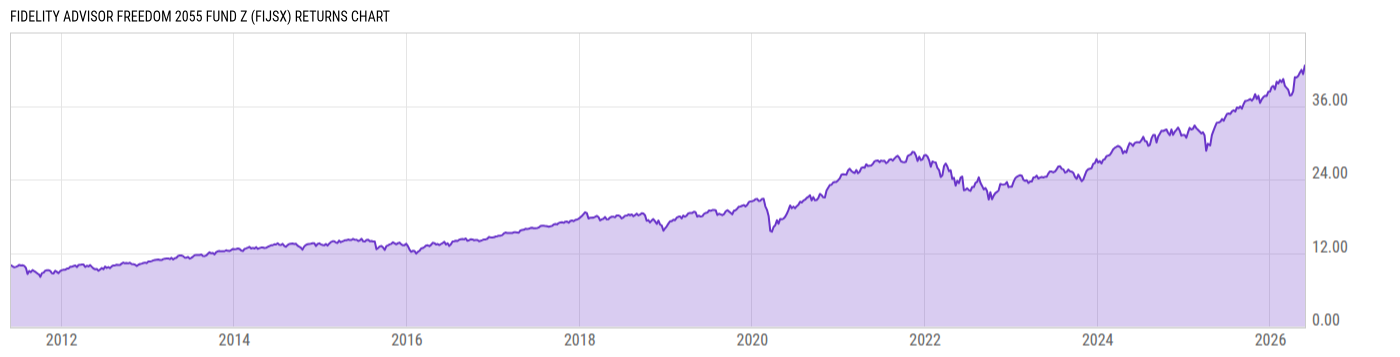
Fidelity Advisor Freedom 2055 Fund Z (FIJSX)
18.48
+0.01
(+0.05%)
USD |
May 27 2026
Returns Chart
Key Stats
| Net Expense Ratio | Total Assets Under Management | Weighted Average Dividend Yield | Turnover Ratio (Generic) |
|---|---|---|---|
| 0.65% | 1.561B | -- | 25.00% |
| 1 Year Fund Level Flows | 1 Year Total Returns (Daily) | Annualized Total Returns Since Inception (Daily) | Max Drawdown (Since Inception) |
| -22.56M | 27.92% |
Basic Info
| Investment Strategy | |
| The Fund seeks high total return with a secondary objective of principal preservation. The Fund invests in a combination of domestic equity funds, international equity funds, bond funds, and short-term funds using a moderate allocation for investors expected to retire around 2055. |
| General | |
| Security Type | Mutual Fund |
| Equity Style | -- |
| Broad Asset Class | Allocation |
| Broad Category | Allocation |
| Global Peer Group | Target Maturity MA USD 2055 |
| Peer Group | Mixed-Asset Target 2055 Funds |
| Global Macro | Target Maturity |
| US Macro | Mixed-Assets Target Date Funds |
| YCharts Categorization | -- |
| YCharts Benchmark | -- |
| Prospectus Objective | Growth Funds |
| Fund Owner Firm Name | Fidelity Investments |
| Broad Asset Class Benchmark Index | |
| ^SPXTR | 100.0% |
Net Fund Flows Versus Peer Group
1 Month
% Rank:
84
-134.07M
Peer Group Low
536.43M
Peer Group High
1 Year
% Rank:
69
-22.56M
-787.56M
Peer Group Low
4.184B
Peer Group High
3 Months
% Rank:
66
-214.71M
Peer Group Low
1.681B
Peer Group High
3 Years
% Rank:
83
-711.58M
Peer Group Low
12.07B
Peer Group High
6 Months
% Rank:
74
-414.15M
Peer Group Low
2.353B
Peer Group High
5 Years
% Rank:
79
-1.112B
Peer Group Low
12.32B
Peer Group High
YTD
% Rank:
69
-351.59M
Peer Group Low
1.681B
Peer Group High
10 Years
% Rank:
39
-1.463B
Peer Group Low
18.72B
Peer Group High
Date Unavailable
Risk
Performance Versus Peer Group
Annual Total Returns Versus Peers
As of May 28, 2026.
Asset Allocation
As of March 31, 2026.
| Type | % Net |
|---|---|
| Cash | 1.73% |
| Stock | 93.19% |
| Bond | 4.67% |
| Convertible | 0.00% |
| Preferred | 0.64% |
| Other | -0.23% |
Top 10 Holdings
| Name | % Weight | Price | % Change |
|---|---|---|---|
| Fidelity Series Large Cap Stock Fund | 11.41% | 29.26 | 0.00% |
| Fidelity Series Emerging Markets Opportunities Fnd | 10.38% | 31.75 | 0.35% |
| Fidelity Advisor Series Equity Growth Fund | 8.31% | 18.16 | 0.28% |
| Fidelity Series International Value Fund | 7.69% | 16.83 | -0.41% |
| Fidelity Series Overseas Fund | 7.62% | 15.71 | -0.38% |
| Fidelity Series International Growth Fund | 7.54% | 20.49 | -0.15% |
| Fidelity Series Opportunistic Insights Fund | 7.10% | 27.90 | 0.14% |
| Fidelity Series Stock Selector Large Cap Value | 6.62% | 15.27 | -0.07% |
| Fidelity Series Value Discovery Fund | 6.62% | 18.36 | 0.22% |
| Fidelity Advisor Series Growth Opportunities Fund | 5.80% | 20.31 | 1.04% |
Fees & Availability
| Fees | |
| Actual 12B-1 Fee | -- |
| Actual Management Fee | 0.64% |
| Administration Fee | -- |
| Maximum Front Load | -- |
| Maximum Deferred Load | -- |
| Maximum Redemption Fee | -- |
| General Availability | |
| Available for Insurance Product | No |
| Available for RRSP | No |
| Purchase Details | |
| Open to New Investors |
|
| Minimum Initial Investment | 0.00 None |
| Minimum Subsequent Investment | 0.00 None |
Basic Info
| Investment Strategy | |
| The Fund seeks high total return with a secondary objective of principal preservation. The Fund invests in a combination of domestic equity funds, international equity funds, bond funds, and short-term funds using a moderate allocation for investors expected to retire around 2055. |
| General | |
| Security Type | Mutual Fund |
| Equity Style | -- |
| Broad Asset Class | Allocation |
| Broad Category | Allocation |
| Global Peer Group | Target Maturity MA USD 2055 |
| Peer Group | Mixed-Asset Target 2055 Funds |
| Global Macro | Target Maturity |
| US Macro | Mixed-Assets Target Date Funds |
| YCharts Categorization | -- |
| YCharts Benchmark | -- |
| Prospectus Objective | Growth Funds |
| Fund Owner Firm Name | Fidelity Investments |
| Broad Asset Class Benchmark Index | |
| ^SPXTR | 100.0% |
Fundamentals
| General | |
| Distribution Yield | -- |
| Dividend Yield TTM (5-26-26) | 1.30% |
| 30-Day SEC Yield (10-3-23) | 0.00% |
| 7-Day SEC Yield (10-3-23) | 0.00% |
| Number of Holdings | 44 |
| Stock | |
| Weighted Average PE Ratio | 28.13 |
| Weighted Average Price to Sales Ratio | 6.492 |
| Weighted Average Price to Book Ratio | 7.708 |
| Weighted Median ROE | 44.38% |
| Weighted Median ROA | 12.77% |
| ROI (TTM) | 18.85% |
| Return on Investment (TTM) | 18.85% |
| Earning Yield | 0.0470 |
| LT Debt / Shareholders Equity | 0.6876 |
| Number of Equity Holdings | 0 |
As of March 31, 2026
Growth Metrics
| EPS Growth (1Y) | 28.33% |
| EPS Growth (3Y) | 19.48% |
| EPS Growth (5Y) | 24.75% |
| Sales Growth (1Y) | 14.68% |
| Sales Growth (3Y) | 13.07% |
| Sales Growth (5Y) | 14.59% |
| Sales per Share Growth (1Y) | 17.89% |
| Sales per Share Growth (3Y) | 13.70% |
| Operating Cash Flow - Growth Rate (3Y) | 22.54% |
As of March 31, 2026
Fund Details
Top Portfolio Holders
| Name | % Weight |
|---|---|
| Portfolio A | 5.00% |
| Portfolio B | 3.50% |
| Portfolio C | 2.25% |
Excel Add-In Codes
| Name: =YCI("M:FIJSX", "name") |
| Broad Asset Class: =YCI("M:FIJSX", "broad_asset_class") |
| Broad Category: =YCI("M:FIJSX", "broad_category_group") |
| Prospectus Objective: =YCI("M:FIJSX", "prospectus_objective") |
| To find the codes for any of our securities and financial metrics, see our Complete Excel Reference. |