

Fidelity Advisor Series Growth Opportunities Fund (FAOFX)
18.99
-0.13
(-0.68%)
USD |
Jul 27 2026
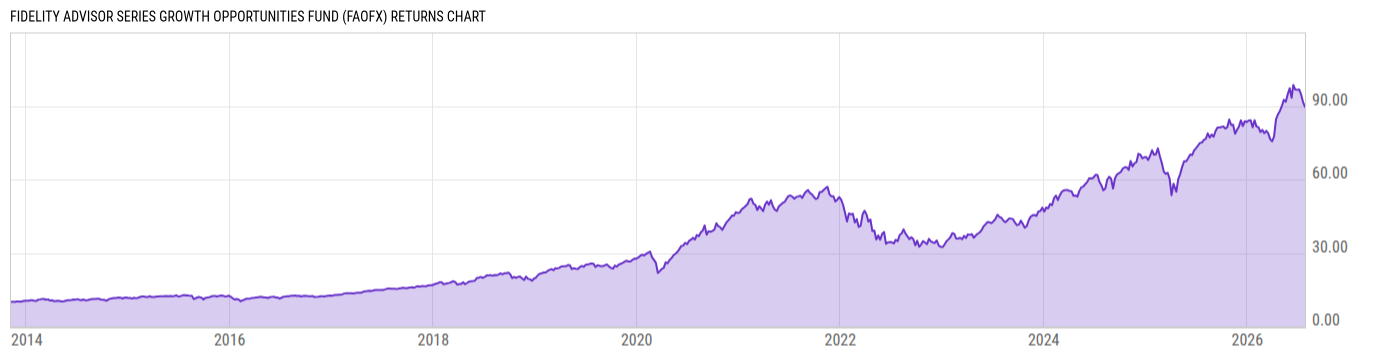
Returns Chart
Key Stats
| Net Expense Ratio | Total Assets Under Management | Weighted Average Dividend Yield | Turnover Ratio (Generic) |
|---|---|---|---|
| 0.00% | 1.112B | 0.26% | 82.00% |
| 1 Year Fund Level Flows | 1 Year Total Returns (Daily) | Annualized Total Returns Since Inception (Daily) | Max Drawdown (Since Inception) |
| -203.33M | 17.37% |
Basic Info
| Investment Strategy | |
| The Fund seeks capital appreciation. The Fund will be investing in companies that Fidelity Management & Research Company (FMR) believes have above-average growth potential. The Fund normally invests in common stocks by domestic and foreign issuers. The Fund will use fundamental analysis to select investments. |
| General | |
| Security Type | Mutual Fund |
| Equity Style | Large Cap Growth |
| Broad Asset Class | US Equity |
| Broad Category | Equity |
| Global Peer Group | Equity US |
| Peer Group | Large-Cap Growth Funds |
| Global Macro | Equity North America |
| US Macro | Large-Cap Funds |
| YCharts Categorization | -- |
| YCharts Benchmark | -- |
| Prospectus Objective | Growth Funds |
| Fund Owner Firm Name | Fidelity Investments |
| Broad Asset Class Benchmark Index | |
| ^SPXTR | 100.0% |
Net Fund Flows Versus Peer Group
1 Month
% Rank:
43
-3.365B
Peer Group Low
4.450B
Peer Group High
1 Year
% Rank:
54
-203.33M
-22.24B
Peer Group Low
26.46B
Peer Group High
3 Months
% Rank:
74
-7.640B
Peer Group Low
12.88B
Peer Group High
3 Years
% Rank:
48
-59.35B
Peer Group Low
57.72B
Peer Group High
6 Months
% Rank:
59
-10.33B
Peer Group Low
15.64B
Peer Group High
5 Years
% Rank:
41
-82.08B
Peer Group Low
72.09B
Peer Group High
YTD
% Rank:
60
-10.33B
Peer Group Low
15.64B
Peer Group High
10 Years
% Rank:
44
-132.72B
Peer Group Low
106.36B
Peer Group High
Date Unavailable
Risk
Performance Versus Peer Group
Annual Total Returns Versus Peers
As of July 28, 2026.
Asset Allocation
As of May 31, 2026.
| Type | % Net |
|---|---|
| Cash | 0.03% |
| Stock | 98.01% |
| Bond | 0.13% |
| Convertible | 0.03% |
| Preferred | 1.72% |
| Other | 0.08% |
Top 10 Holdings
| Name | % Weight | Price | % Change |
|---|---|---|---|
| NVIDIA Corp. | 12.93% | 196.97 | 0.23% |
| Amazon.com, Inc. | 6.90% | 231.27 | -0.05% |
| Microsoft Corp. | 6.87% | 398.18 | 2.33% |
| Meta Platforms, Inc. | 5.46% | 595.19 | 0.22% |
| Alphabet, Inc. | 4.46% | 333.23 | 2.04% |
| Alphabet, Inc. | 4.33% | 332.59 | 1.84% |
| Apple, Inc. | 3.39% | 340.41 | 1.04% |
| Eli Lilly & Co. | 3.21% | 1218.08 | 1.72% |
|
Space Exploration Technologies Corp P/P
|
3.13% | -- | -- |
| Applovin Corp. | 3.12% | 417.36 | 1.12% |
Fees & Availability
| Fees | |
| Actual 12B-1 Fee | -- |
| Actual Management Fee | 0.00% |
| Administration Fee | -- |
| Maximum Front Load | -- |
| Maximum Deferred Load | -- |
| Maximum Redemption Fee | -- |
| General Availability | |
| Available for Insurance Product | No |
| Available for RRSP | No |
| Purchase Details | |
| Open to New Investors |
|
| Minimum Initial Investment | 0.00 None |
| Minimum Subsequent Investment | 0.00 None |
Projected Income
| Type | Jul | Aug | Sep | Oct | Nov | Dec | Jan | Feb | Mar | Apr | May | Jun |
|---|---|---|---|---|---|---|---|---|---|---|---|---|
|
Qualified Income
|
-- | -- | -- | -- | -- | -- | -- | -- | -- | -- | -- | -- |
|
Normal
|
-- | -- | -- | -- | -- | -- | -- | -- | -- | -- | -- | -- |
|
Qualified
|
-- | -- | -- | -- | -- | -- | -- | -- | -- | -- | -- | -- |
|
LT Cap Gains
|
-- | -- | -- | -- | -- | -- | -- | -- | -- | -- | -- | -- |
|
Ordinary Income
|
-- | -- | -- | -- | -- | -- | -- | -- | -- | -- | -- | -- |
|
Non-Qual
|
-- | -- | -- | -- | -- | -- | -- | -- | -- | -- | -- | -- |
|
ST Cap Gains
|
-- | -- | -- | -- | -- | -- | -- | -- | -- | -- | -- | -- |
|
Interest
|
-- | -- | -- | -- | -- | -- | -- | -- | -- | -- | -- | -- |
|
Tax-Exempt
|
-- | -- | -- | -- | -- | -- | -- | -- | -- | -- | -- | -- |
|
ROC
|
-- | -- | -- | -- | -- | -- | -- | -- | -- | -- | -- | -- |
|
Other
|
-- | -- | -- | -- | -- | -- | -- | -- | -- | -- | -- | -- |
|
Total
|
-- | -- | -- | -- | -- | -- | -- | -- | -- | -- | -- | -- |
As of June 30, 2026.
Basic Info
| Investment Strategy | |
| The Fund seeks capital appreciation. The Fund will be investing in companies that Fidelity Management & Research Company (FMR) believes have above-average growth potential. The Fund normally invests in common stocks by domestic and foreign issuers. The Fund will use fundamental analysis to select investments. |
| General | |
| Security Type | Mutual Fund |
| Equity Style | Large Cap Growth |
| Broad Asset Class | US Equity |
| Broad Category | Equity |
| Global Peer Group | Equity US |
| Peer Group | Large-Cap Growth Funds |
| Global Macro | Equity North America |
| US Macro | Large-Cap Funds |
| YCharts Categorization | -- |
| YCharts Benchmark | -- |
| Prospectus Objective | Growth Funds |
| Fund Owner Firm Name | Fidelity Investments |
| Broad Asset Class Benchmark Index | |
| ^SPXTR | 100.0% |
Fundamentals
| General | |
| Distribution Yield | -- |
| Dividend Yield TTM (7-27-26) | 0.50% |
| 30-Day SEC Yield (10-3-23) | 0.00% |
| 7-Day SEC Yield (10-3-23) | 0.00% |
| Number of Holdings | 192 |
| Stock | |
| Weighted Average PE Ratio | 38.97 |
| Weighted Average Price to Sales Ratio | 12.74 |
| Weighted Average Price to Book Ratio | 14.80 |
| Weighted Median ROE | 68.90% |
| Weighted Median ROA | 27.59% |
| Return on Investment (TTM) | 35.67% |
| Earning Yield | 0.0293 |
| LT Debt / Shareholders Equity | 0.6343 |
| Number of Equity Holdings | 182 |
As of May 31, 2026
Growth Metrics
| EPS Growth (1Y) | 50.86% |
| EPS Growth (3Y) | 39.95% |
| EPS Growth (5Y) | 39.67% |
| Sales Growth (1Y) | 32.69% |
| Sales Growth (3Y) | 27.37% |
| Sales Growth (5Y) | 26.01% |
| Sales per Share Growth (1Y) | 31.92% |
| Sales per Share Growth (3Y) | 27.78% |
| Operating Cash Flow - Growth Rate (3Y) | 52.06% |
As of May 31, 2026
Fund Details
| Key Dates | |
| Inception Date | 11/7/2013 |
| Last Annual Report Date | 11/30/2025 |
| Last Prospectus Date | 1/29/2026 |
| Attributes | |
| Index Fund | -- |
| Inverse Fund | No |
| Leveraged Fund | -- |
| Fund of Funds | No |
| Currency Hedged Fund | -- |
| Socially Responsible Fund | No |
Top Portfolio Holders
| Name | % Weight |
|---|---|
| Portfolio A | 5.00% |
| Portfolio B | 3.50% |
| Portfolio C | 2.25% |
Excel Add-In Codes
| Name: =YCI("M:FAOFX", "name") |
| Broad Asset Class: =YCI("M:FAOFX", "broad_asset_class") |
| Broad Category: =YCI("M:FAOFX", "broad_category_group") |
| Prospectus Objective: =YCI("M:FAOFX", "prospectus_objective") |
| To find the codes for any of our securities and financial metrics, see our Complete Excel Reference. |