

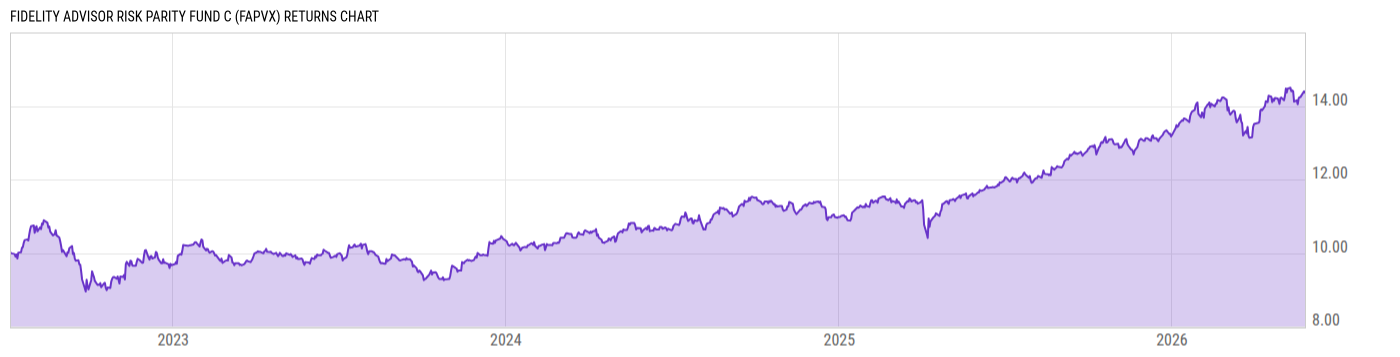
Fidelity Advisor Risk Parity Fund C (FAPVX)
11.71
-0.03
(-0.26%)
USD |
May 27 2026
Returns Chart
Key Stats
| Net Expense Ratio | Total Assets Under Management | Weighted Average Dividend Yield | Turnover Ratio (Generic) |
|---|---|---|---|
| 1.60% | 15.98M | -- | 51.00% |
| 1 Year Fund Level Flows | 1 Year Total Returns (Daily) | Annualized Total Returns Since Inception (Daily) | Max Drawdown (Since Inception) |
| 4.172M | 23.60% |
Basic Info
| Investment Strategy | |
| The Fund seeks total return. Using quantitative analysis to balance the fund's risk across four risk factors: growth (risk of reduced earnings expectations and increased default risk), inflation (risk of rising consumer inflation), real rates (risk of rising real interest rates), and liquidity (risk of reduced liquidity). |
| General | |
| Security Type | Mutual Fund |
| Equity Style | -- |
| Broad Asset Class | Alternative |
| Broad Category | Alternative Strategies |
| Global Peer Group | Alternative Global Macro |
| Peer Group | Alternative Global Macro Funds |
| Global Macro | Liquid Alternatives |
| US Macro | Alternative Equity Funds |
| YCharts Categorization | -- |
| YCharts Benchmark | -- |
| Prospectus Objective | Alternative Global Macro Funds |
| Fund Owner Firm Name | Fidelity Investments |
| Broad Asset Class Benchmark Index | |
| ^MSACWINTR | 100.0% |
Net Fund Flows Versus Peer Group
1 Month
% Rank:
40
-43.97M
Peer Group Low
415.25M
Peer Group High
1 Year
% Rank:
46
4.172M
-2.442B
Peer Group Low
2.011B
Peer Group High
3 Months
% Rank:
43
-94.59M
Peer Group Low
669.08M
Peer Group High
3 Years
% Rank:
46
-6.832B
Peer Group Low
2.812B
Peer Group High
6 Months
% Rank:
45
-320.38M
Peer Group Low
1.253B
Peer Group High
5 Years
% Rank:
37
-8.983B
Peer Group Low
2.763B
Peer Group High
YTD
% Rank:
36
-112.94M
Peer Group Low
997.40M
Peer Group High
10 Years
% Rank:
35
-18.04B
Peer Group Low
3.410B
Peer Group High
Date Unavailable
Risk
Performance Versus Peer Group
Annual Total Returns Versus Peers
As of May 28, 2026.
Asset Allocation
As of March 31, 2026.
| Type | % Net |
|---|---|
| Cash | 10.60% |
| Stock | 38.14% |
| Bond | 54.81% |
| Convertible | 0.00% |
| Preferred | 0.21% |
| Other | -3.76% |
Top 10 Holdings
| Name | % Weight | Price | % Change |
|---|---|---|---|
|
Goldman Sachs International/iShares TIPS Bond ETF TRS
|
17.94% | -- | -- |
| Fidelity Inflation-Protected Bond Index Fund | 17.16% | 9.24 | 0.11% |
|
Bnp Paribas Sa/Invesco Senior Loan ETF TRS
|
16.82% | -- | -- |
| iShares US Treasury Bond ETF | 12.23% | 22.72 | 0.09% |
| Fidelity Commodity Strategy Fund | 11.63% | 120.71 | -0.96% |
|
Goldman Sachs International/iShares iBoxx $ High Yield Corporate Bond ETF TRS
|
8.87% | -- | -- |
|
Goldman Sachs International/SPDR Gold Shares TRS
|
8.84% | -- | -- |
| Fidelity Emerging Markets Index Fund | 8.81% | 17.11 | 0.29% |
| Fidelity Small Cap Value Index Fund | 8.20% | 33.50 | 0.03% |
| iShares JP Morgan EM Local Currency Bond ETF | 8.00% | 41.96 | 0.02% |
Fees & Availability
| Fees | |
| Actual 12B-1 Fee | 1.00% |
| Actual Management Fee | 0.56% |
| Administration Fee | -- |
| Maximum Front Load | -- |
| Maximum Deferred Load | 1.00% |
| Maximum Redemption Fee | -- |
| General Availability | |
| Available for Insurance Product | No |
| Available for RRSP | No |
| Purchase Details | |
| Open to New Investors |
|
| Minimum Initial Investment | 0.00 None |
| Minimum Subsequent Investment | 0.00 None |
Basic Info
| Investment Strategy | |
| The Fund seeks total return. Using quantitative analysis to balance the fund's risk across four risk factors: growth (risk of reduced earnings expectations and increased default risk), inflation (risk of rising consumer inflation), real rates (risk of rising real interest rates), and liquidity (risk of reduced liquidity). |
| General | |
| Security Type | Mutual Fund |
| Equity Style | -- |
| Broad Asset Class | Alternative |
| Broad Category | Alternative Strategies |
| Global Peer Group | Alternative Global Macro |
| Peer Group | Alternative Global Macro Funds |
| Global Macro | Liquid Alternatives |
| US Macro | Alternative Equity Funds |
| YCharts Categorization | -- |
| YCharts Benchmark | -- |
| Prospectus Objective | Alternative Global Macro Funds |
| Fund Owner Firm Name | Fidelity Investments |
| Broad Asset Class Benchmark Index | |
| ^MSACWINTR | 100.0% |
Fundamentals
| General | |
| Distribution Yield | -- |
| Dividend Yield TTM (5-26-26) | 5.88% |
| 30-Day SEC Yield (10-3-23) | 0.00% |
| 7-Day SEC Yield (10-3-23) | 0.00% |
| Number of Holdings | 33 |
| Stock | |
| Weighted Average PE Ratio | 26.91 |
| Weighted Average Price to Sales Ratio | 6.043 |
| Weighted Average Price to Book Ratio | 5.059 |
| Weighted Median ROE | 22.41% |
| Weighted Median ROA | 5.71% |
| ROI (TTM) | 10.42% |
| Return on Investment (TTM) | 10.42% |
| Earning Yield | 0.0551 |
| LT Debt / Shareholders Equity | 0.7952 |
| Number of Equity Holdings | 0 |
| Bond | |
| Yield to Maturity (3-31-26) | 3.46% |
| Effective Duration | -- |
| Average Coupon | 2.98% |
| Calculated Average Quality | 2.288 |
| Effective Maturity | 6.862 |
| Nominal Maturity | 6.880 |
| Number of Bond Holdings | 2 |
As of March 31, 2026
Growth Metrics
| EPS Growth (1Y) | 20.86% |
| EPS Growth (3Y) | 10.37% |
| EPS Growth (5Y) | 16.01% |
| Sales Growth (1Y) | 12.27% |
| Sales Growth (3Y) | 10.25% |
| Sales Growth (5Y) | 12.62% |
| Sales per Share Growth (1Y) | 43.47% |
| Sales per Share Growth (3Y) | 9.05% |
| Operating Cash Flow - Growth Rate (3Y) | 18.25% |
As of March 31, 2026
Fund Details
Top Portfolio Holders
| Name | % Weight |
|---|---|
| Portfolio A | 5.00% |
| Portfolio B | 3.50% |
| Portfolio C | 2.25% |
Excel Add-In Codes
| Name: =YCI("M:FAPVX", "name") |
| Broad Asset Class: =YCI("M:FAPVX", "broad_asset_class") |
| Broad Category: =YCI("M:FAPVX", "broad_category_group") |
| Prospectus Objective: =YCI("M:FAPVX", "prospectus_objective") |
| To find the codes for any of our securities and financial metrics, see our Complete Excel Reference. |